February 28th, 2024 | Posted in Data & Insights
Note: This post was last updated on February 28th, 2024 to include refreshed U.S. stock market returns up until the end of 2023. The U.S. stock market returned +22.1% in 2023 💸
From Canada to Chile, Barcelona to Bali — investors around the globe pay close attention to the U.S. stock market. With the U.S. generating ~25% of global GDP, and U.S. companies weighing in at ~60% of global stock markets, the long-term performance of all of our investments is heavily influenced by the performance of the U.S. market.
This post will cover a few facts and figures on the history of U.S. stock market returns:
- What is the average return of the stock market?
- How often does the stock market go down?
- Gauging the impact of short / long time horizons and the likelihood of losing money in the market
- The best months and worst months in stock market history
Understanding historical stock market returns can help to inform your financial plans, from planning for retirement, or figuring out whether it makes more sense to rent or buy your home. Plus, it’s plenty of fun for data geeks 🧐
Throughout this post we’ll be relying on a fantastic data set released and maintained by Professor Robert Shiller, giving us data on U.S. stock market returns all the way back to the 1870s — a data set covering more than 150 years.
Onto the good stuff!
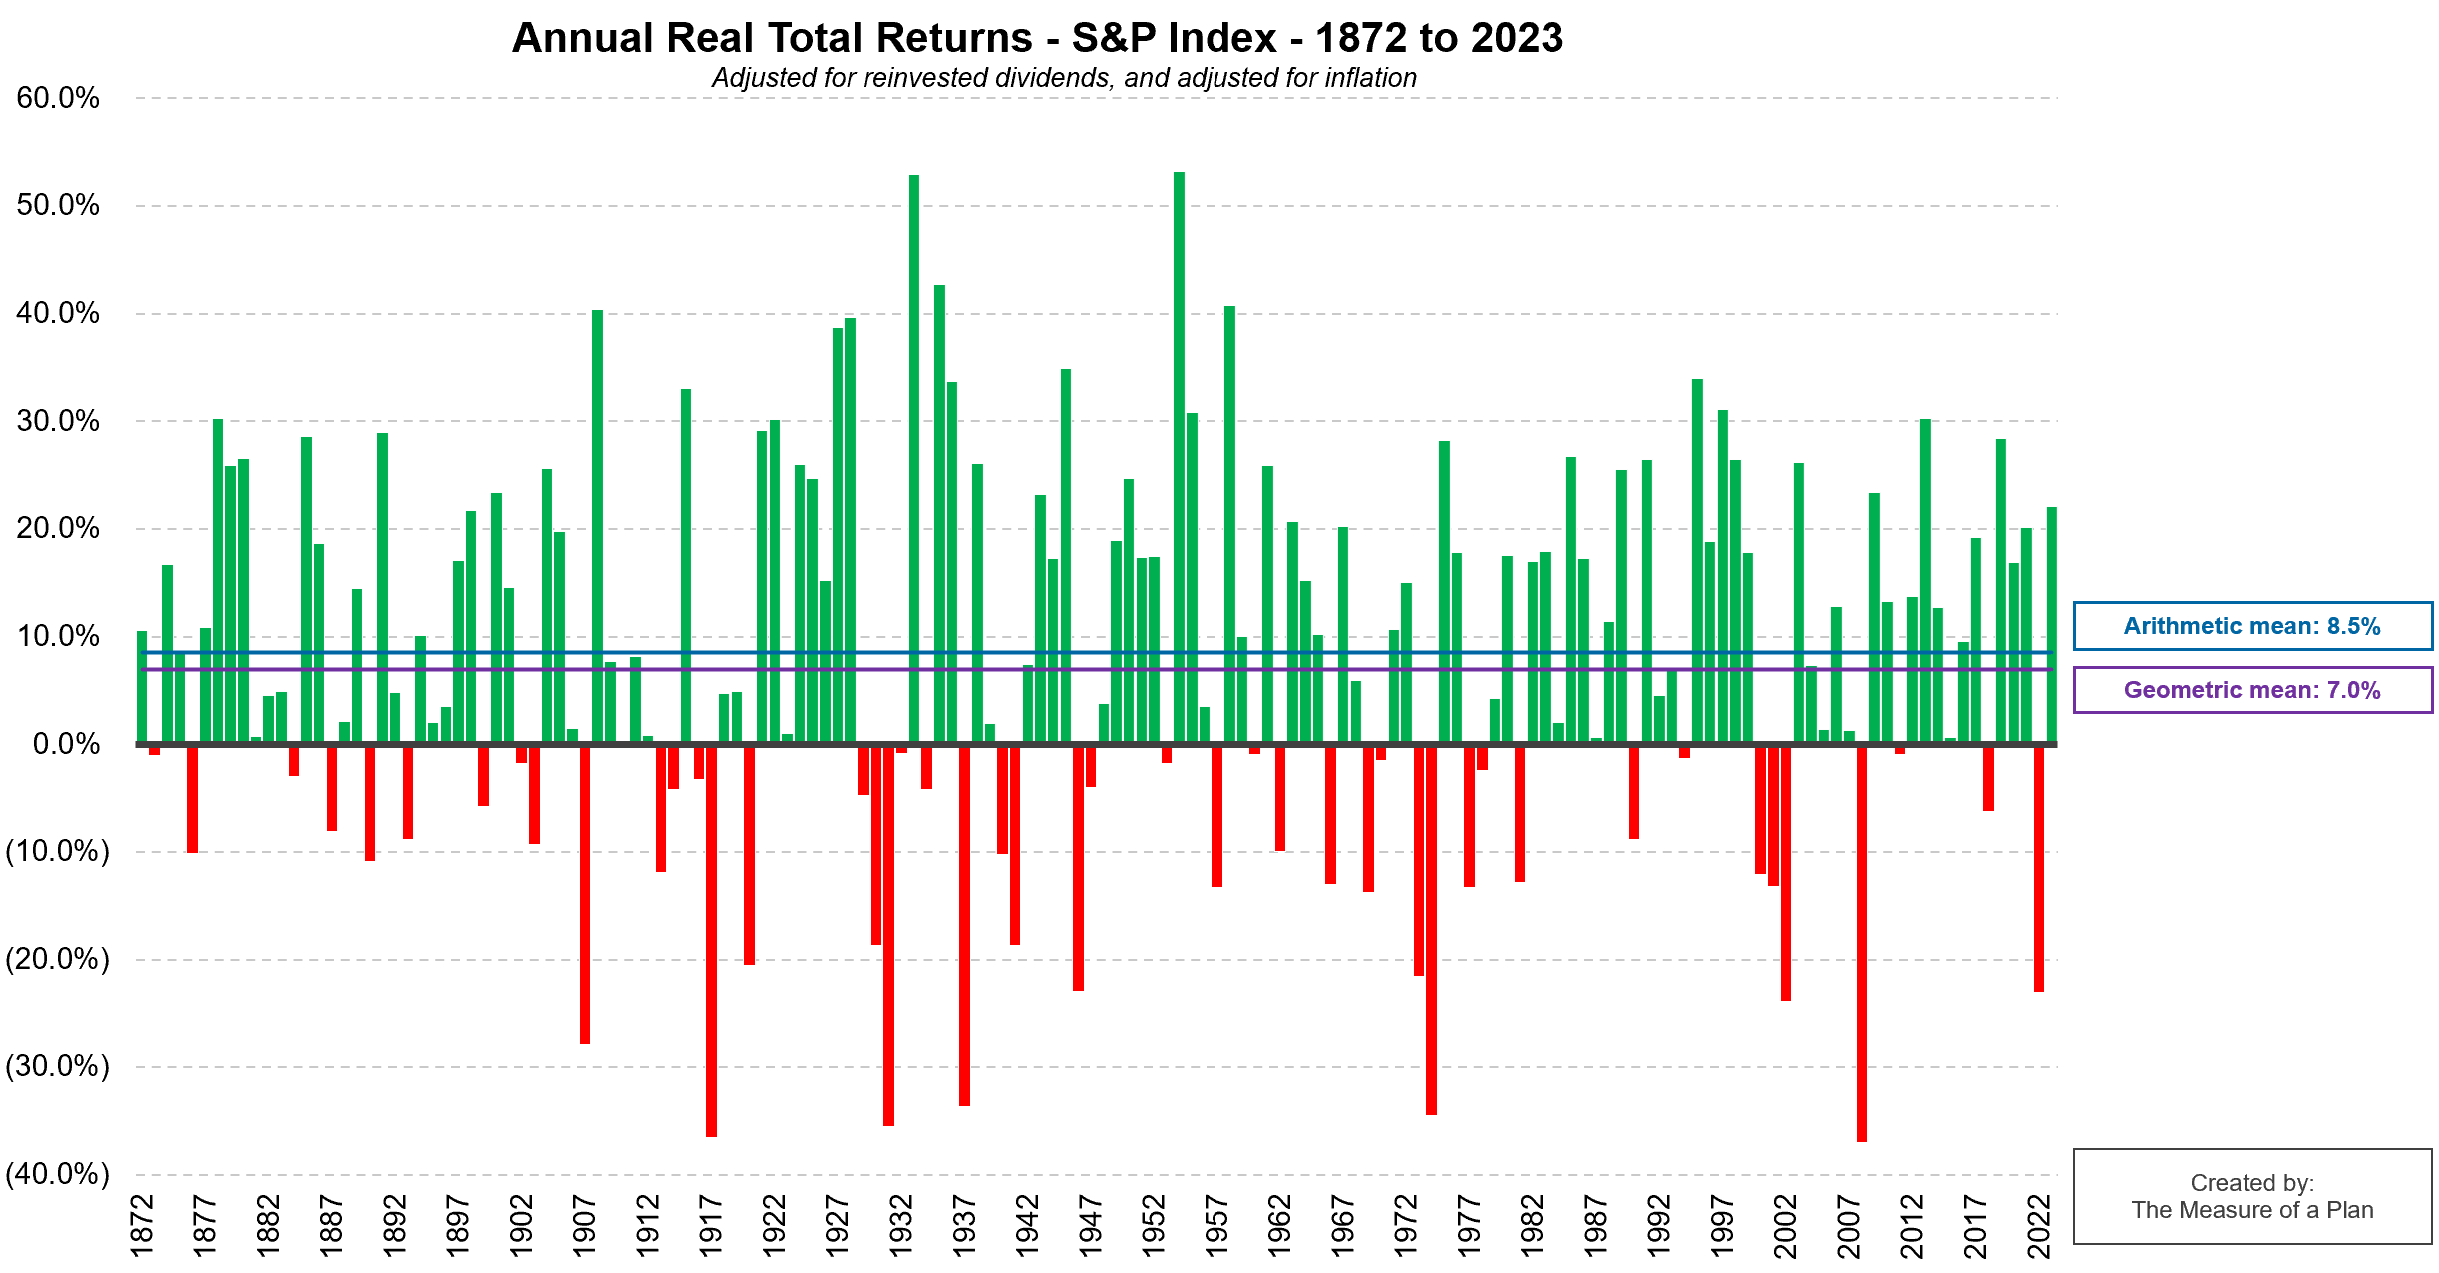
U.S. Stock Market Returns by Year
What is the average annual return of the U.S. stock market?
- The average return of the U.S. stock market has been 8.5% per year over the past 152 years (1871 to 2023); note that this is the “simple” average across all years (also known as the “arithmetic” average)
- The annualized return (also known as the “geometric” average) of the U.S. stock market from start to finish has been 7.0% per year. This represents the compounded annual return that you would have earned if you’d invested over this whole period
This showcases why many financial planners tend to assume returns of 5% to 8% per year in the stock market.
Note: these figures are “real total returns”, meaning that they’ve been adjusted to include the re-investment of dividends, and have also been adjusted for inflation.
Distribution of Annual Returns
How often does the stock market go down?
- While the U.S. stock market has generally trended upwards over time, it isn’t always rainbows and unicorns. The market has grown in 69% of all years on record, and declined in 31% of years on record
- U.S. stock market returns in any single year can be extremely volatile. There have been 5 cases where the market declined by 30 to 40% in a single year (1917, 1931, 1937, 1974, and 2008)
- You don’t need to go back too far for evidence of losses in the stock market losses — in 2022, the U.S. stock market dropped by 23.3% (real total return of the S&P 500 index)

Buy, Hold… Profit?
The wild swings of the market are reduced if we start to look at time horizons that are longer than a single year.
In the animation below, you can see how U.S. stock market returns have fared when we look at 1 / 5 / 10 / 20 year rolling periods.
- Taking a 1-year view, we see lots of red — there were plenty of years in which the market was down, and sometimes down significantly.
- As we consider longer and longer time periods (stretching our view out to 5 years, then 10 years, and finally 20 years), the range of possibilities narrows, and the chance of losing money diminishes.
- Once we zoom it out to look at 20-year periods, you won’t see any more flashes of red. In other words, The U.S. stock market has never declined over any 20-year period.
And down below you’ll find the same chart, but this time shown as a static picture.
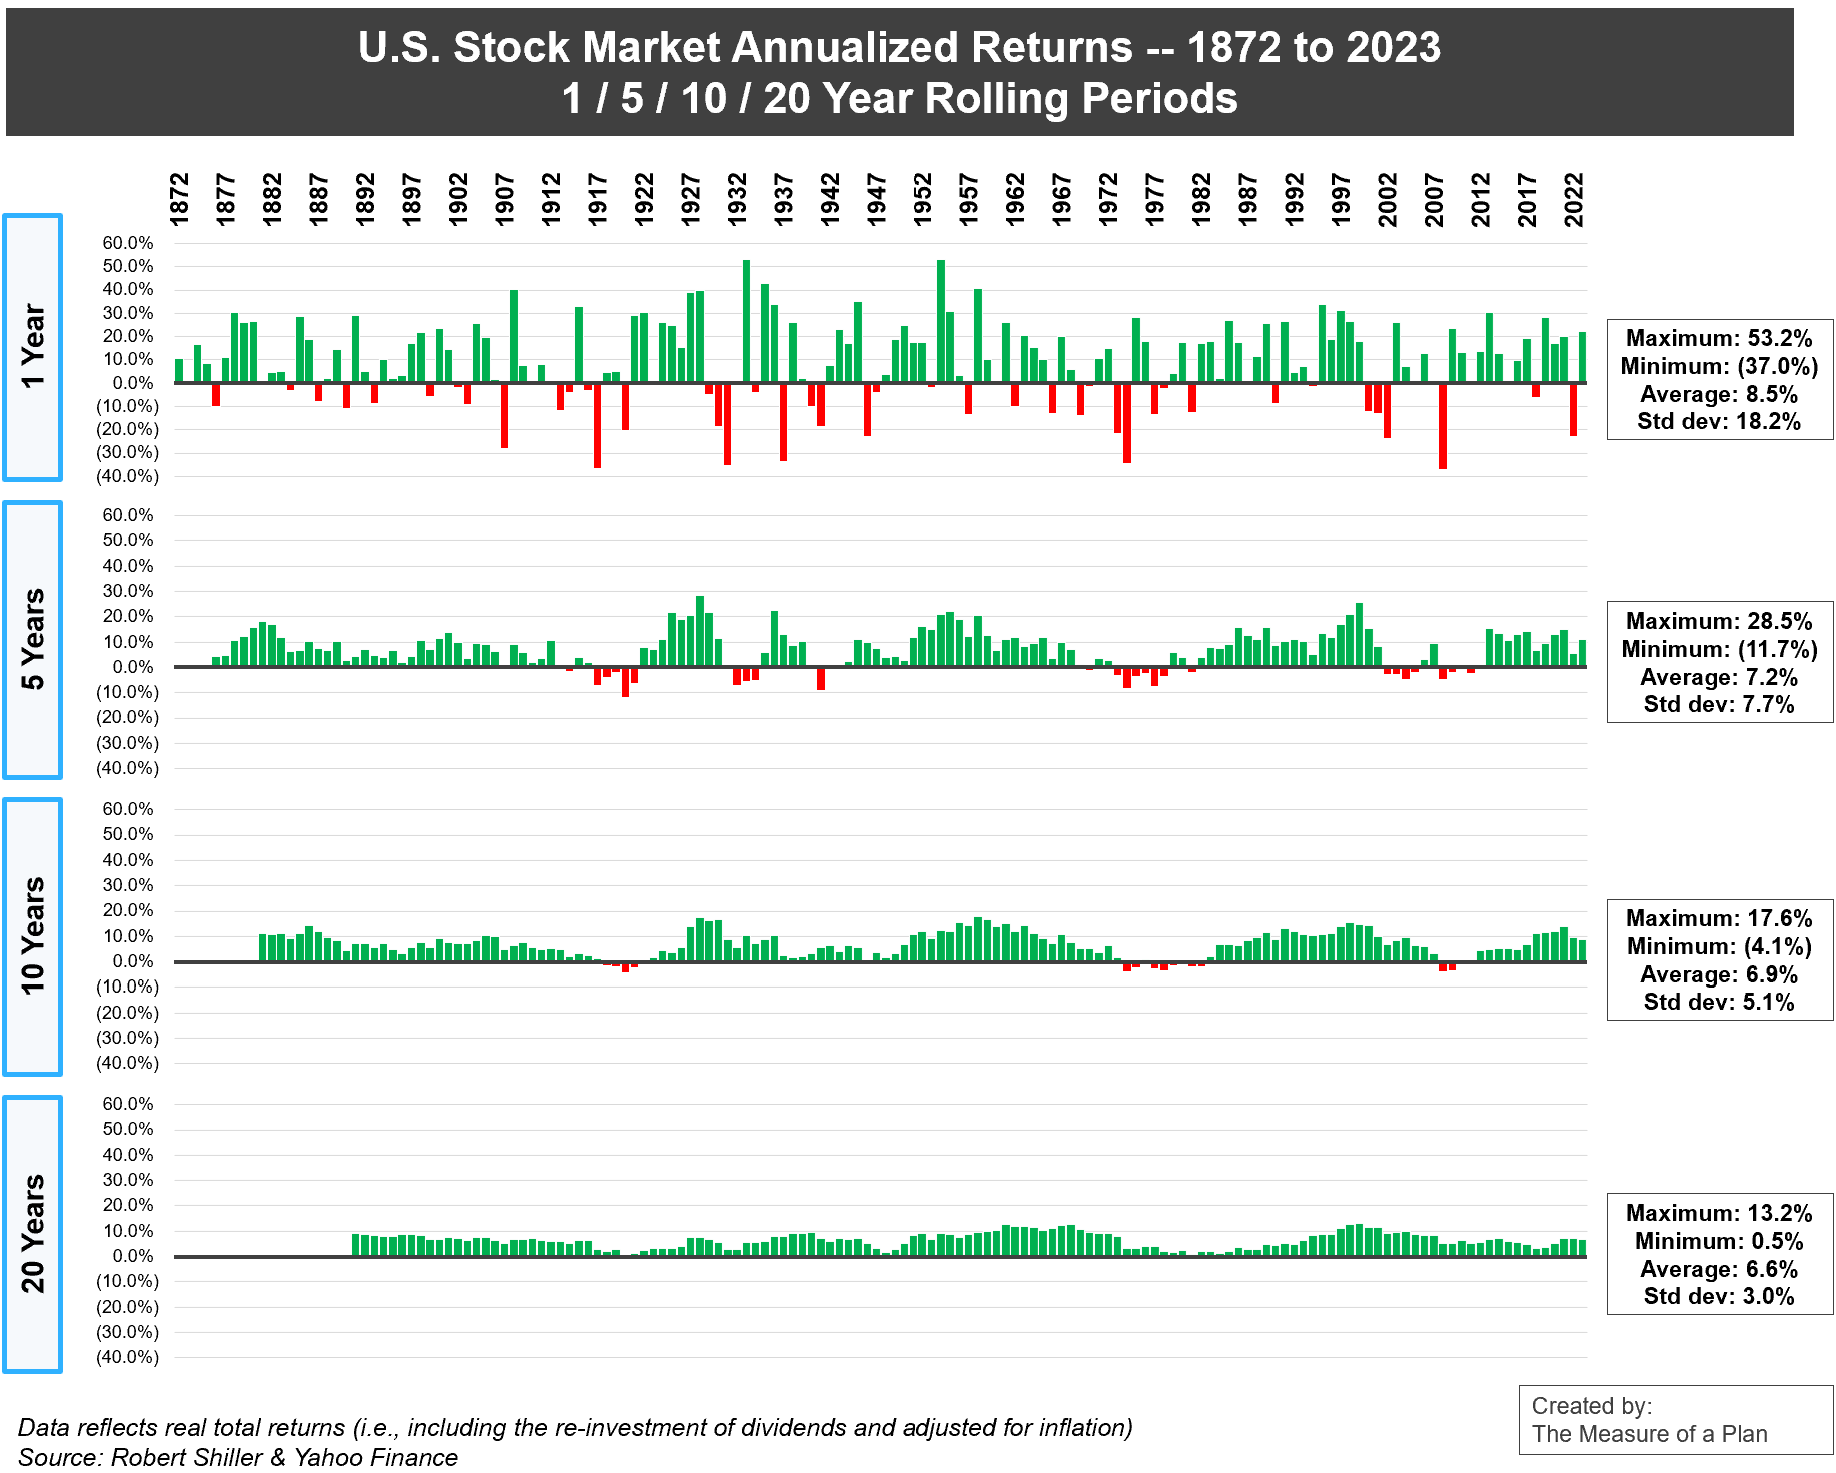
To summarize: while the range of returns across 1-year periods has varied significantly (from negative 37.0% to +53.2%), the annualized returns across 20-year periods have a much tighter range (from +0.5% to +13.2%).

In the long run, U.S. stocks have delivered strong returns. However, if your investment horizon is short (0-5 years), your savings are likely better suited towards less volatile assets such as bonds, GICs, or high interest savings accounts.
U.S. Stock Market Returns by Decade
Across the entire period spanning 1871 until 2023, U.S. stocks have increased at +4.7% per year excluding dividends, +9.2% per year including dividends, and +6.9% per year including dividends and also adjusting for inflation.

The Best and Worst Months in Stock Market History
The table below lists the 20 months on record with the highest returns, and the 20 months with the lowest returns (without adjusting for dividends or inflation).
A familiar story: in the short-term, the stock market is far from predictable.

The best month in stock market history was August 1932, when the market gained 50.3% in a single month!

On the other hand, the worst month in stock market history was November 1929, with a decline of 26.5%. The worst month in recent memory was October 2008 (during the depths of the Great Recession), when the stock market dropped by 16.9%.
$1,000 — Then and Now
If you had invested $1,000 in the U.S. stock market on Dec. 31st, 1969 and held the investment until Dec. 31, 2023 (without buying or selling during that 54-year period), your investment would have grown to ~$230k before inflation, or ~$28k after adjusting for inflation.

Historically, buying and holding (and potentially forgeting about the investment entirely) has been a simple and straightforward way to build wealth.
Final Thoughts
If you’re looking to make a quick buck by jumping in and out of the market, quite often you’ll find yourself on the losing end of things. Over short time periods, there’s no telling if the market will go up, down, or sideways.
However, if you have the patience and fortitude to hold onto your investments for 10 or 20+ years, your prospects become much brighter. You’ll ride out the short-term noise and benefit from the long-term upwards trend 🚀.
As always, Warren Buffet put it best: “the stock market is a device for transferring money from the impatient to the patient”.
That being said! If you’d like to try your hand at beating the performance of a simple buy-and-hold strategy, I invite you to play this simple market timing simulator game.
***
For the data-heads, click here to download an excel file which contains all of the underlying data on U.S. stock market returns, along with the charts shown in this post.
Data sources:
Robert Shiller U.S. stock market data
Yahoo finance S&P 500 historical data
FRED U.S. CPI (inflation) data
Note: for the purposes of this post, the “U.S. stock market” refers to the S&P Composite index from 1871 to 1957, and the S&P 500 index from 1957 until today, which is aligned with the definition used by Professor Shiller.
[…] As an example, look at the Vanguard 500 Index Fund (VFIAX), which tracks the performance of the S&P 500. In 2018, the fund actually had a negative return of -4.38%. And during the recession in 2008, it had a negative return of -37%. But over long periods of time, the index has gone steadily up. There hasn’t been a single 20-year period in its history in which the S&P 500 posted negative returns, according to data compiled by Measure of a Plan. […]
[…] a 150-year study of the U.S. stock market by Nobel Laureate Robert Shiller, if you invested […]
[…] a 150-year study of the U.S. stock market by Nobel Laureate Robert Shiller, if you invested […]
[…] a 150-year study of the U.S. stock market by Nobel Laureate Robert Shiller, if you invested […]
[…] a 150-year study of the U.S. stock market by Nobel Laureate Robert Shiller, if you invested […]
[…] a 150-year study of the U.S. stock market by Nobel Laureate Robert Shiller, if you invested […]
[…] a 150-year study of the U.S. stock market by Nobel Laureate Robert Shiller, if you invested […]
[…] a 150-year study of the U.S. stock market by Nobel Laureate Robert Shiller, if you invested […]
[…] a 150-year study of the U.S. stock market by Nobel Laureate Robert Shiller, if you invested […]
[…] a 150-year study of the U.S. stock market by Nobel Laureate Robert Shiller, if you invested […]
[…] a 150-year study of the U.S. stock market by Nobel Laureate Robert Shiller, if you invested […]
[…] a 150-year study of the U.S. stock market by Nobel Laureate Robert Shiller, if you invested […]
[…] a 150-year study of the U.S. stock market by Nobel Laureate Robert Shiller, if you invested […]
[…] a 150-year study of the U.S. stock market by Nobel Laureate Robert Shiller, if you invested […]
[…] a 150-year study of the U.S. stock market by Nobel Laureate Robert Shiller, if you invested […]
[…] un Étude de 150 ans sur le marché boursier américain par le lauréat du prix Nobel Robert Shiller, si vous avez investi […]
[…] a 150-year study of the U.S. stock market by Nobel Laureate Robert Shiller, should you invested […]
[…] un Étude de 150 ans sur le marché boursier américain par le lauréat du prix Nobel Robert Shiller, si vous avez investi […]
[…] a 150-year study of the U.S. stock market by Nobel Laureate Robert Shiller, if you invested […]
[…] Rendements moyens annualisés glissants, de 1872 à 2018. Note : Les chiffres de Measure of a Plan ne correspondent pas exactement à ceux de Vanguard car ils sont basés sur des indices de marché différents. Source : Mesure of a plan […]
It would be intreasting if a similar study could be conducted for a 60/40 portfolio of stocks and bonds with various rolling period returns
[…] animation comes to us from The Measure of a Plan, and it shows the performance of the U.S. market over different rolling time horizons using […]
[…] animation comes to us from The Measure of a Plan, and it shows the performance of the U.S. market over different rolling time horizons using […]
[…] As an example, look at the Vanguard 500 Index Fund (VFIAX), which tracks the performance of the S&P 500. In 2018, the fund actually had a negative return of -4.38%. And during the recession in 2008, it had a negative return of -37%. But over long periods of time, the index has gone steadily up. There hasn’t been a single 20-year period in its history in which the S&P 500 posted negative returns, according to data compiled by Measure of a Plan. […]
[…] animation comes to us from The Measure of a Plan, and it shows the performance of the U.S. market over different rolling time horizons using […]
[…] The second is capital gains, which means selling a fund that has increased in price. At the end of the year, these funds distribute the capital gains to its investors. “You earn money the same way you’d earn money investing in most other ways,” says Erin Lowry, the author of Broke Millennial Takes on Investing. “If the value of your investments has increased by the time you sell, then you’ve made money.”The third way is through net asset value. Mutual funds trade at the end of trading day and this is when their assets are valued. These assets are known as NAV, or net asset value. It’s the price per mutual fund share. As these funds increase, the price to purchase shares does too. There are no immediate distributions but you’d make money should you decide to sell it. “Mutual funds are often products that are purchased for a longer time-horizon (fancy investing jargon for time until you need the money and therefore sell your investment) instead of a quick buy and sell as soon as the price of the fund has increased,” Lowry said.While it’s definitely possible to grow wealth in a mutual fund, it’s also possible to lose money. Stock mutual funds, in particular, are closely tied to the performance of the stock market. As an example, look at the Vanguard 500 Index Fund (VFIAX), which tracks the performance of the S&P 500. In 2018, the fund actually had a negative return of -4.38%. And during the recession in 2008, it had a negative return of -37%. But over long periods of time, the index has gone steadily up. There hasn’t been a single 20-year period in its history in which the S&P 500 posted negative returns, according to data compiled by Measure of a Plan. […]
[…] did not gain in value ever since it began in 1872, according to research from personal finance site Measure of a Plan. As old companies fail and new ones emerge, the S&P 500 is reformulated to reflect the current […]
[…] did not gain in value ever since it began in 1872, according to research from personal finance site Measure of a Plan. As old companies fail and new ones emerge, the S&P 500 is reformulated to reflect the current […]
[…] did not gain in value ever since it began in 1872, according to research from personal finance site Measure of a Plan. As old companies fail and new ones emerge, the S&P 500 is reformulated to reflect the current […]
[…] did not gain in value ever since it began in 1872, according to research from personal finance site Measure of a Plan. As old companies fail and new ones emerge, the S&P 500 is reformulated to reflect the current […]
[…] did not gain in value ever since it began in 1872, according to research from personal finance site Measure of a Plan. As old companies fail and new ones emerge, the S&P 500 is reformulated to reflect the current […]
[…] did not gain in value ever since it began in 1872, according to research from personal finance site Measure of a Plan. As old companies fail and new ones emerge, the S&P 500 is reformulated to reflect the current […]
[…] since 1950, and the stock market has recovered and then some every single time. In fact, the stock market’s average annual rate of return over the last 150 years is over […]
[…] 1950, and the inventory market has recovered after which some each single time. In actual fact, the inventory market’s common annual fee of return over the past 150 years is over […]
[…] U.S. Stock Market Returns – 1870s to Present […]
[…] The second is capital positive aspects, which suggests promoting a fund that has elevated in worth. On the finish of the yr, these funds distribute the capital positive aspects to its buyers. “You earn cash the identical method you’d earn cash investing in most different methods,” says Erin Lowry, the creator of Broke Millennial Takes on Investing. “If the worth of your investments has elevated by the point you promote, then you definitely’ve made cash.”The third method is thru web asset worth. Mutual funds commerce on the finish of buying and selling day and that is when their property are valued. These property are often called NAV, or web asset worth. It’s the value per mutual fund share. As these funds improve, the value to buy shares does too. There are not any instant distributions however you’d become profitable do you have to resolve to promote it. “Mutual funds are sometimes merchandise which might be bought for an extended time-horizon (fancy investing jargon for time till you want the cash and subsequently promote your funding) as a substitute of a fast purchase and promote as quickly as the value of the fund has elevated,” Lowry mentioned.Whereas it’s positively potential to develop wealth in a mutual fund, it’s additionally potential to lose cash. Inventory mutual funds, specifically, are intently tied to the efficiency of the inventory market. For instance, take a look at the Vanguard 500 Index Fund (VFIAX), which tracks the efficiency of the S&P 500. In 2018, the fund really had a unfavourable return of -4.38%. And in the course of the recession in 2008, it had a unfavourable return of -37%. However over lengthy durations of time, the index has gone steadily up. There hasn’t been a single 20-year interval in its historical past by which the S&P 500 posted unfavourable returns, in accordance with information compiled by Measure of a Plan. […]
[…] animation comes to us from The Measure of a Plan, and it shows the performance of the U.S. market over different rolling time horizons using […]
[…] animation kommer til os fra The Measure of a Plan , og den viser præstationerne på det amerikanske marked over forskellige rullende tidshorisonter […]
[…] animation kommer til os fra The Measure of a Plan , og den viser præstationerne på det amerikanske marked over forskellige rullende tidshorisonter […]
[…] U.S. Stock Market Returns – a history from the 1870s to 2022 >> * Human gene linked to bigger brains was born from seemingly useless DNA >> * The Superpower […]