May 2nd, 2018 | Posted in Retirement, Tools
Get the retirement date forecasting tool as an excel file (recommended) or as a Google Sheets file. For Google Sheets, you need to log in to your google account, and then click File –> Make a Copy
Retirement? Yes, Retirement…
For most of us, golden pensions are a thing of the past. Without a guaranteed monthly check to rely on, funding your retirement requires strong planning, and even stronger execution.
In this post, I’ll walk you through the Retirement Date Forecasting Tool that I’ve built. We’ll see how it can help you understand your current trajectory towards retirement, and set new targets to get where you want to go.
Our retirement planning should begin by getting a grasp on a few key facts:
- How much money do I need to retire?
- How close am I to retirement now? How long will it take to get there based on my current spending and saving habits?
- How much will I need to save, and what returns will I need on my investments in order to retire when I’d like to?
With this knowledge in hand, we can then set long-term targets that will help us reach our retirement goals.
To get started, please download a copy of the Retirement Date Forecasting tool. I highly recommend using the Excel version if you have access to Excel, given that it includes a scenario analysis feature which I’ve yet to be able to replicate in Google Sheets, and because it lets you switch between charts to view at the press a button. If you don’t have excel, the Google Sheets version has 95% of the same functionality and is more than serviceable.
See the Excel version in action below. Some good fun to be had in pressing the buttons and watching the charts fly by…

How to Use the Retirement Date Forecasting Tool
First things first, navigate to the “Retirement Forecasting Tool” tab, and enter in your own assumptions. To get a handle on how the tool works, let’s take the example of Mike – a 24 year old who has been working for a couple of years, and wants to figure out how he can set himself up in a solid position for his eventual retirement.
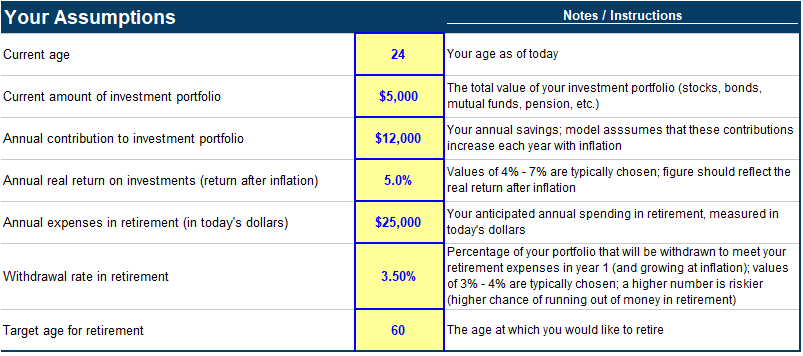
Mike has already managed to save up $5,000, and will be able to save an additional $12,000 per year, with investment returns of 5% per year (real returns after inflation).
In retirement, Mike expects to have expenses of $25,000 per year, and would like to retire at age 60 using a withdrawal rate of 3.5%.
After you’ve inputted your assumptions, everything else is automatically calculated for you.
What Assumptions Should I Use?
Investment returns
The US stock market has delivered a real return of 6.9% per year from 1871 to 2017. Using a return assumption of 4% to 7% would be reasonable.
Expenses in retirement
Input your best guess for your annual expenses in retirement. Starting to track your expenses today would be a good step if you aren’t sure of what your current spending habits are.
If you expect to have a government benefit payment when you retire (e.g., social security, old age security), you can subtract this amount from your expenses. Please note that the earlier you retire, the lower your benefit payment would be. As such, I would stay on the safe side and not include this benefit unless you are sure you will receive it.
Withdrawal rate
The withdrawal rate represents the maximum percentage of your portfolio that can be spent in a year, without running out of money in retirement. Values of 3% to 4% are typically considered ‘safe’, and have worked in the vast majority of historical time periods.
The higher the withdrawal rate you choose, the faster you will be able to retire. However, a higher withdrawal rate also increases the risk that you run out of money in retirement. The withdrawal rate that is ‘safe’ for your situation is dependent on the investment returns you will be able to achieve, and the length of your retirement.
An illustrative example of the relationship between the “withdrawal rate” assumption and the resulting amount required for you to retire:
- If you plan to spend $30,000 per year in retirement, and assume a 4% withdrawal rate, you will need a portfolio valued at $750,000 in order to retire ($750,000 x 4% = $30,000)
- However if you assume a 3% withdrawal rate, you’d need a portfolio of $1,000,000 in order to fund the same $30,000 of annual spending in retirement ($1,000,000 x 3% = $30,000)
- Put another way, a lower withdrawal rate means you need more money before you can retire, and therefore the age at which you can retire is higher
The short answer is that you should use a withdrawal rate between 3% and 4% and test out how the answers change if you vary that number. If you want to really dig into the details of withdrawal rates, please see this fantastic series of posts by Early Retirement Now.
Results of Your Retirement Scenario
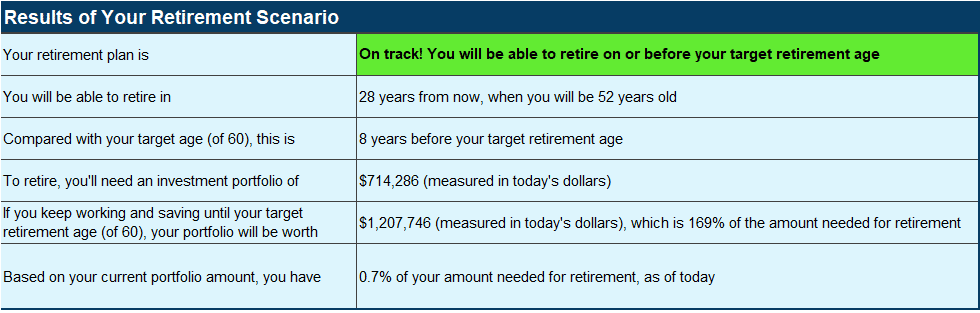
Mike is on track! Based on the assumptions he has entered, he’ll be able to retire in 28 years (at age 52), a healthy 8 years before his target age of 60.
Mike will need a portfolio of ~$714,000 to retire.
Note that all dollar figures in this post are measured in today’s dollars – i.e., they are adjusted for inflation.
If Mike chooses to continue working and saving until his target age of 60, he would have a portfolio of ~$1.2 million, which would provide a good buffer over the amount actually needed to fund his retirement.
After reading through these results, move to the “Outputs and Charts” section. In the excel version, you can click on the menu of buttons to toggle between viewing the various charts, as shown in the animation above. In the Google Sheets version, you will need to scroll through the charts one by one.
Now, we’ll walk through each of the charts included in the tool, and explain how these answers are derived.
Please note that this tool is meant to calculate how much money you need to retire / when you’d get there. This tool does not model out the “withdrawal phase” after you are retired and stop earning income.
Chart 1: # of Years to Retirement
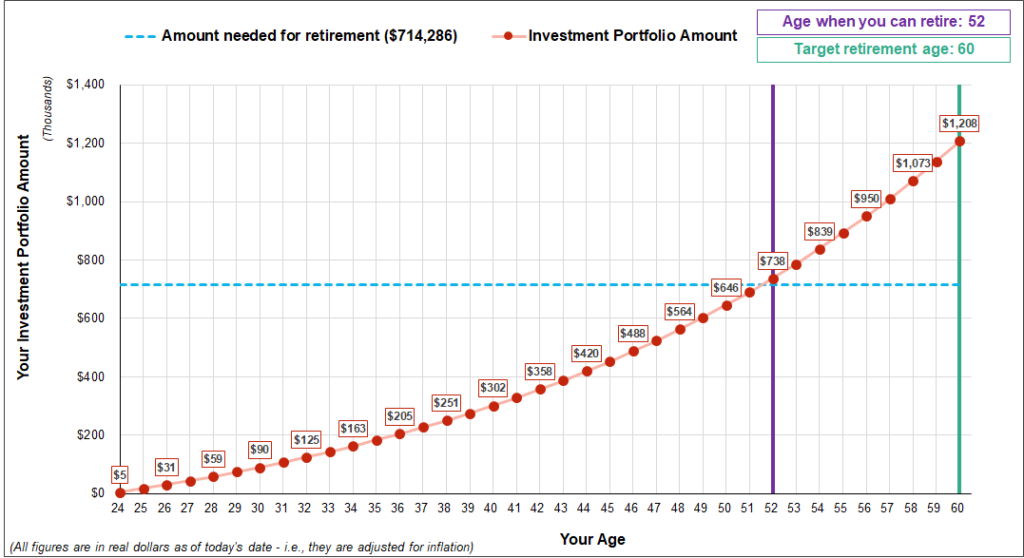
As seen in the Retirement Results section, Mike needs a portfolio of ~$714,000 to retire. A portfolio of ~$714,000 will provide $25,000 of income at a 3.5% withdrawal rate, thereby fully funding Mike’s expenses in retirement.
Based on Mike’s savings during his working years, and the investment returns being earned on the portfolio, Mike will reach the amount required for retirement when he is 52 years old, when his portfolio grows to be ~$738,000.
If Mike does not retire at 52, and chooses to continue working and saving until his target retirement age of 60, he will have a portfolio of ~$1.2 million.
Chart 2: Passive Income and % Progress to Retirement
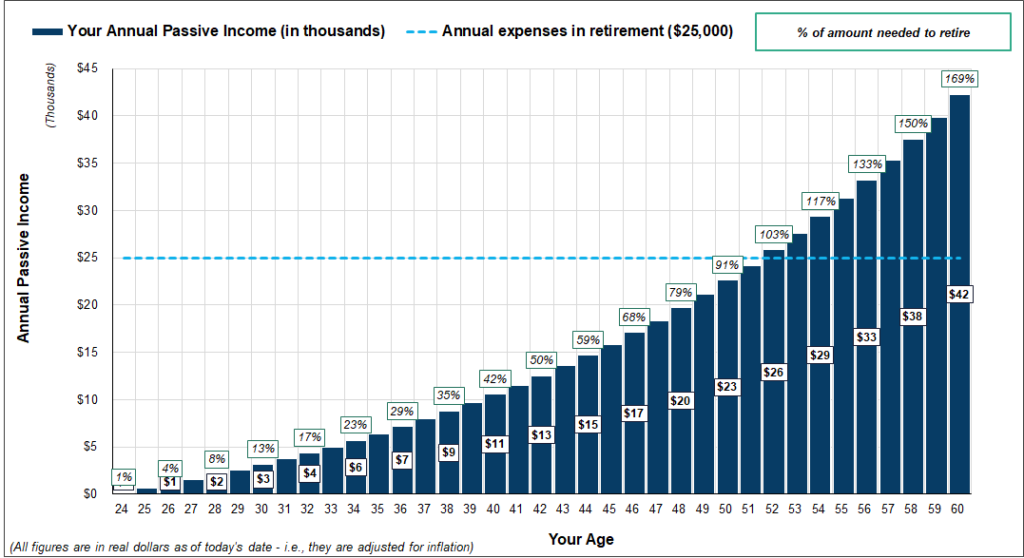
As the value of Mike’s portfolio increases over time, the amount of ‘passive income’ generated by his portfolio increases as well.
Passive income is calculated as the total portfolio value multiplied by the withdrawal rate. This represents the amount that could be withdrawn from the portfolio each year without running out of money in retirement.
Note that a higher withdrawal rate would allow Mike to generate higher income, but would increase the risk that Mike runs out of money in retirement. As mentioned above, a withdrawal rate of 3% to 4% has been safe in the majority of time periods.
When Mike is 52, his portfolio will generate ~$26,000 of passive income per year, which is enough to cover his expenses in retirement of $25,000. As such, Mike could retire at this point, since his expenses would be funded by the income generated by his portfolio.
Again, if Mike chooses to work and continue to save until 60, he will build up an even greater cushion, with his passive income of ~$42,000 per year being 169% of the amount needed to retire.
Chart 3: # of Years of Retirement Spending Saved
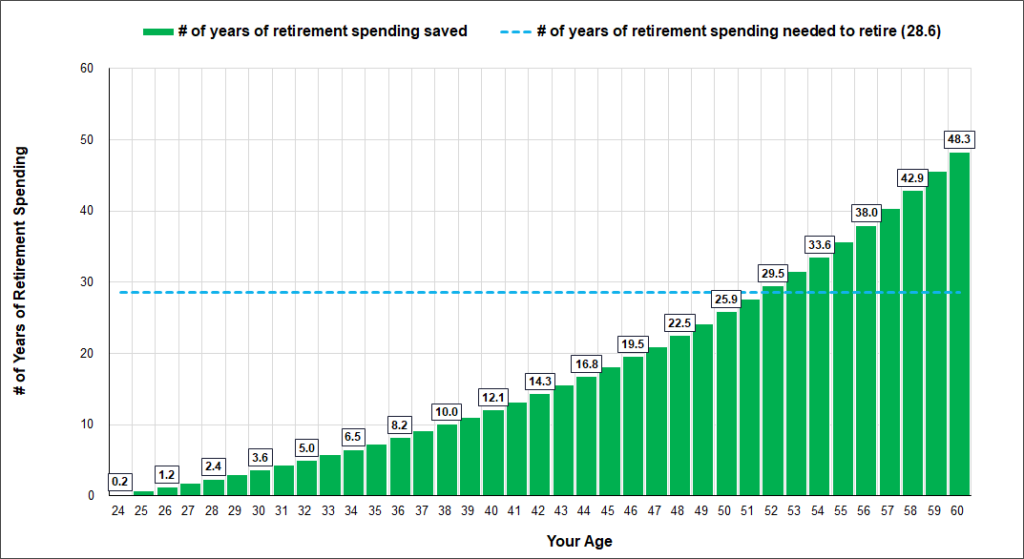
As of today, Mike’s portfolio value of $5,000 only represents 0.2 years of annual spending in retirement.
However, by age 38 Mike will have saved up 10 years of expenses. By age 52, Mike will have saved up 29.5 years of retirement expenses, which is enough to retire on. Note that Mike’s portfolio will actually last longer than 29.5 years in retirement, given that his portfolio will still be generating investment returns above inflation, meaning that the portfolio would likely stay flat or even increase in value after Mike retires.
Mike needs to reach a target of 28.6 years of expenses saved in order to retire, which is calculated as the inverse of the withdrawal rate (1 divided by 3.5% equals 28.6).
While the total dollar value of your portfolio can sometimes be a bit of an abstract concept, thinking about it in terms of ‘years of expenses saved’ is a much more tangible way of looking at it.
Chart 4: Breakeven Analysis
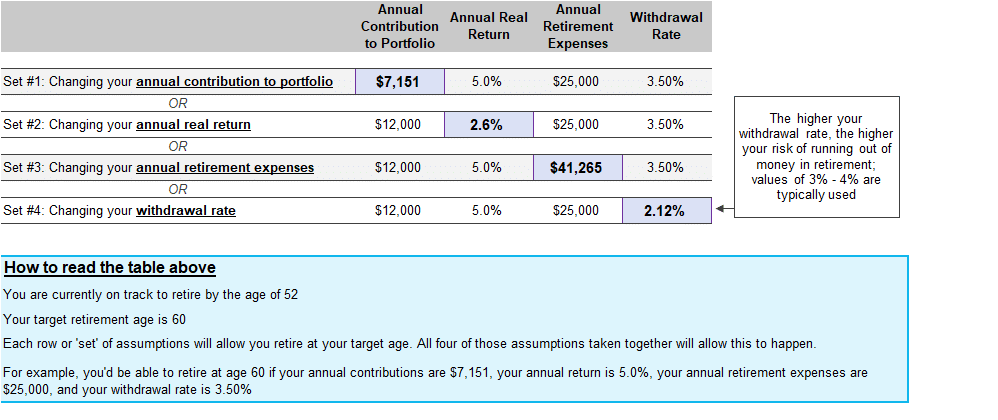
We’ve seen in a few different ways that Mike would be able to retire by the age of 52. However, life is not a spreadsheet (a positive or a negative depending on how you look at it…). This analysis is based on assumptions spanning multiple decades into the future, so we need to take them with a grain of salt.
What if Mike’s assumptions for savings, investment returns, or retirement expenses don’t turn out like he thought they would? What would need to happen for Mike to retire at 60 (his target age)? The breakeven analysis chart has those answers.
If Mike’s annual savings are only $7,151 per year (instead of $12,000), he will be retirement-ready at age 60 (instead of 52). This assumes that all of the other assumptions stay the same as before (5% investment returns, $25,000 annual retirement expenses, and 3.5% withdrawal rate).
Another way for Mike to be retirement-ready at 60 (instead of 52) would be if his investments only return 2.6% per year (instead of 5.0%). Likewise for his retirement expense assumption ($41,265 instead of $25,000) and his withdrawal rate assumption (2.12% instead of 3.5%).
This chart shows you what assumptions you need to ‘beat’ to retire before your target retirement age. If you don’t believe that you can beat these assumptions, you will need to re-assess your plan to see how you can increase your savings, and/or delay your retirement date.
Chart 5: Scenario Analysis
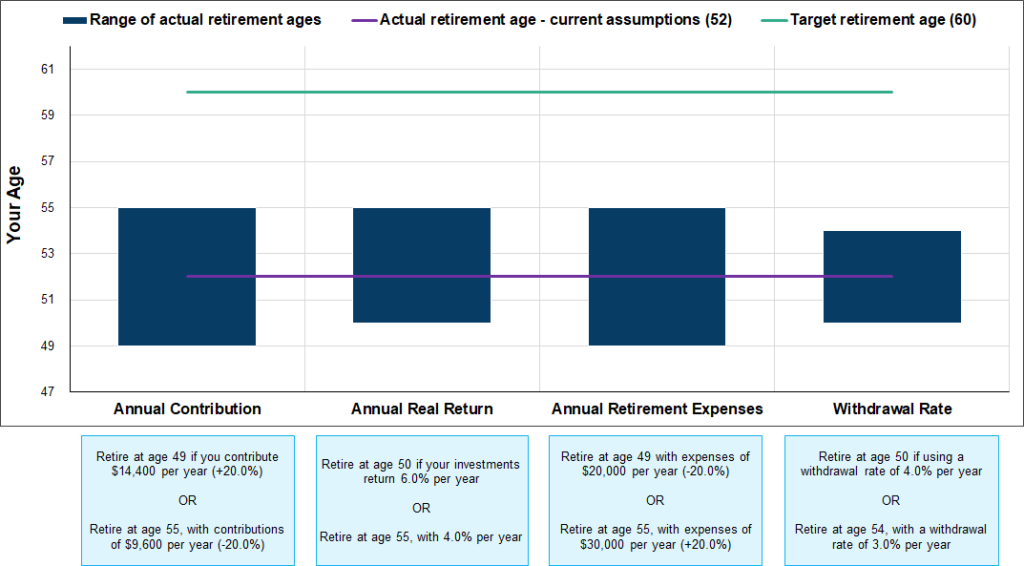
Note: unfortunately I haven’t been able to figure out how to add this into the Google Sheets version yet, so this analysis is only found in the excel version for now.
In the scenario analysis chart, we continue to stress-test our assumptions. Here, we can see how the final answers change based on slight tweaks to the assumptions.
Mike assumed he would save $12,000 per year; what if that number is slightly higher or lower? In this case, Mike would be able to retire at 49 if he saves $14,400 per year (an increase of 20%), or he could retire at 55 if he saves $9,600 per year (a decrease of 20%). This is relative to the baseline result of retirement at 52, if Mike saves $12,000 per year.
The sensitivity +/- range for this analysis can be adjusted on the “Scenario Analysis Assumptions” tab (only in excel for now).
Chart 6: Breakdown of Investment Portfolio – Contributions vs Returns
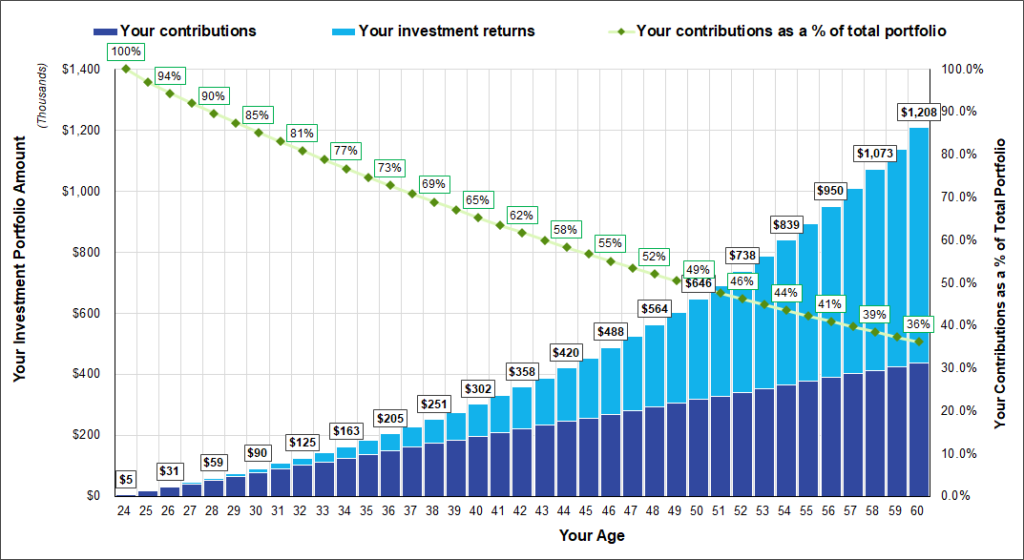
This chart shows how the value of Mike’s total portfolio is split between money that he saved directly, and money made from investment returns. Mike’s portfolio at age 52 would be worth ~$738,000, with 46% of the total coming from his contributions, and the remaining 54% coming from investment returns. Cheers to compound interest!
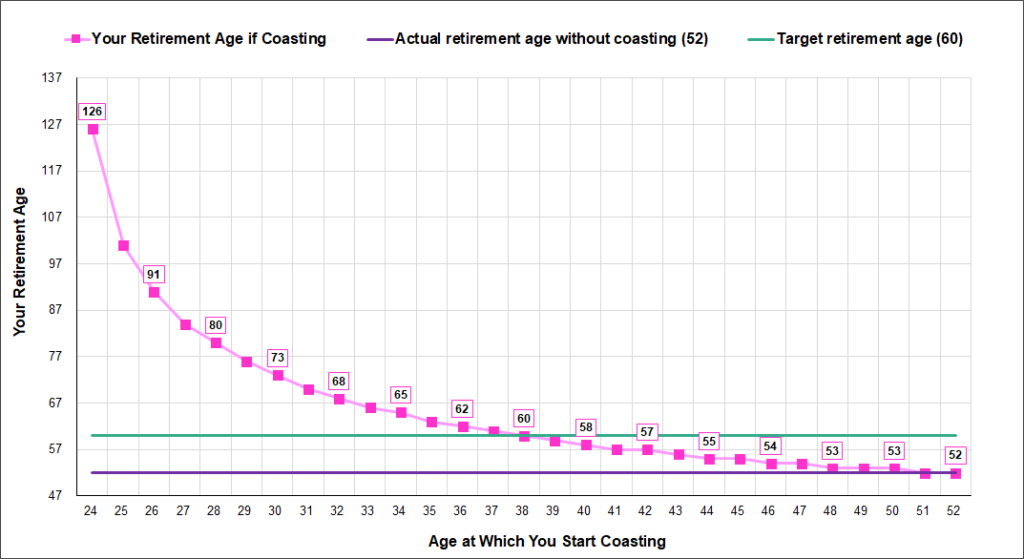
Chart 7: Coast Retirement Analysis
The ‘coast retirement’ concept involves choosing to shift into a lower paying job which just meets your expenses, and letting your portfolio grow until you reach your retirement amount without contributing any additional savings.
On one hand, your retirement date would be delayed since you earn less money and stop contributing to your portfolio. On the other hand, this can enable you to pursue a career that you are passionate about (writing, freelance work, a non-profit?) while still managing to retire in a reasonable time frame. Instead of racing to the finish line at your current job, you can slow it down, move into a career which is more fulfilling, and ‘coast’ to retirement.
Let’s say that Mike doesn’t love his job, and doesn’t want to continue working there all the way up until the age of 52, when he could retire. Instead of being cooped up in an office, Mike wants to turn his woodworking hobby into a small business.
The chart above shows that if Mike left his office job at age 38, he would still be able to retire at age 60, assuming that his woodworking business earns enough to meet his expenses (but not a dollar more), for a total of 22 years – from age 38 to 60. In doing this, Mike has traded 14 years of working at his old job (from age 38 to 52), in exchange for 22 years of working at his more fulfilling new job. In both cases, Mike manages to reach his retirement goal.
This math relies on the fact that Mike has already saved up ~$251,000 by the age of 38. If his portfolio compounds at a 5% real rate of return per year, he does not need to contribute any additional money for that amount to grow to ~$734,000 by age 60 (higher than his retirement-ready amount of ~$714,000).
You’ll also see from the chart above that if Mike decided to start ‘coasting’ at the age of 24, he would only be able to retire at the age of 126. Perhaps not the best choice.
While not for everyone, the coast concept is an interesting option to consider, especially for those who have already managed to save up a decent nest egg and feel that they may be burning out at their current job.
Choosing to coast can open up many attractive paths: moving to part-time work, taking a job which gives you more freedom over your time, or pursuing something you’ve always wanted to do but which doesn’t pay that well.
Final Thoughts
If you haven’t already done so, please download the tool (links to the excel and google sheets versions are at the top of this post) and give it a try with your own assumptions.
I encourage you to play around with different assumptions to see how your results change. Please keep in mind that these are only assumptions, and that any model which seeks to forecast decades into the future will always give a ballpark estimate at best. Using conservative assumptions and building in buffer into your scenarios would be wise.
I hope that this tool gives you a greater understanding of how on track you are with your own retirement, and helps you to build a plan for how you can get there. While the idea of retirement can seem like a hazy possibility far into the future, it can be achieved with a dose of planning and discipline. The best time to start was yesterday, but today works nearly as well!
If you have any questions, comments, or feedback, please let me know in the comments below or by email at themeasureofaplan@gmail.com.
—
Header image credit: Saturday Cartoons by Mark Stivers
Thank you so much!
This was super easy to use and very intuitive. Loved playing around with different scenarios and seeing the results.
Cheers! Happy to hear that. Please let me know if you have any questions or feedback on the tool.
Hi, thanks for this tool but the charts are showing up as white squares. Any workaround on this? I am using excel 2007
Hey Steve,
There is a macro running in the excel file which may be causing the issue. Can you try the Google Sheets version to see if that works?
You’ll need to open the spreadsheet in your browser, log in to your google account, and then click file –> make a copy. Then you can save on your own drive and edit the spreadsheet directly in your browser.
Let me know if you still have issues.
I know this is an old post, but I’ve been coming back and looking at this spreadsheet a few times since it was made, and the one thing that keeps gnawing at me is that there’s no way to adjust the return rate at retirement (or even over time). I could be misunderstanding something, but unless the idea is that I continue to invest aggressively (ie: 80% equities), I don’t see how I could maintain the same return rate in return as leading up to it.
I think it may also help to show portfolio size in retirement up to a certain number of years (or perhaps life expectancy).
Hey Ben, thanks for the comment.
I should make this more clear; this tool is meant to show you how many years it would take for you to reach the amount of money needed for retirement. The tool is NOT meant to model out the period post-retirement.
For example, if you will have annual expenses of $50k in retirement, and feel comfortable at a 4% withdrawal rate, you’d need to save up $1.25M ($50k / 0.04) in order to retire. This tool shows you when you would get to that point based on your current trajectory (age, net worth, savings per year).
Once you reach that point, the analysis stops.
i.e., this tool is for the “accumulation phase”, and not for the “withdrawal phase” in which you actually retire and start to draw down on your accounts. The withdrawal phase is something that I plan to tackle in another tool.
I’ll try to clarify in the post. Thanks for raising this.
Hey! A very lovely sheet. Haven’t played with it too much but I look forward to doing a bit more of a deep dive on my retirement savings requirements. On the surface, if I had some constructive criticism, it would be that perhaps to include a section that lets people account for other sources of income at retirement. IE CPP, OAS, and pensions.
Thanks James.
Agreed with you on the sources of income in retirement. I’d made a comment in the post that if you expect to have a pension or government benefit payment when you retire (e.g., social security, old age security), you can subtract this amount from your expenses.
The tricky part is that this income often only arrives at age 65+ (or thereabouts), whereas this tool can indicate a retirement-ready age of less than 65. The tool could indicate that you have enough saved at 40 to retire, for example. If so, this additional retirement income only arrives in the future, and is thus difficult to factor in.
I’ve tried to keep the tool simple (and also err on the safe side) by not including this additional retirement income explicitly.
In the future, I’d like to build a tool which models out the accumulation phase (as done here), and also the withdrawal phase where you start drawing down on your portfolio. This more comprehensive tool would be able to handle this additional retirement income given that it would reflect a person’s entire lifetime (instead of just stopping when they’ve reached the amount needed for retirement).
Cheers, and apologies for the long and slightly rambling reply.
Hi How would I change everything to pounds? wonderful spreadsheet!
Hi Patrick,
Thanks for the comment and the kind words.
Unfortunately there isn’t any easy way to change the currency to pounds throughout the spreadsheet.
This would involve a manual process of going through the spreadsheet and changing the values to pounds by following these instructions:
https://www.howtogeek.com/240316/how-to-change-the-currency-symbol-for-certain-cells-in-excel/
In the excel spreadsheet, all cells and charts below row 83 would need to be changed to pounds.
If this is too cumbersome, the easier solution would just be to input your figures in as if they were pounds, and then just ignore the “$” sign (i.e., if your annual living expenses are 50,000 pounds per year, just input $50,000, and pretend that you don’t see the $ sign).
Sorry I can’t be more helpful.
HI there!
First of all thanks for doing this, I was gonna start my own and found yours, which is awesome 🙂
I think I found a problem though: The “Withdrawal rate in retirement” seems to be inverted; Whenever I put a small %, the age of retirement increases. Shouldn’t it be the opposite?
Thanks! 🙂
Hi!
The withdrawal rate concept is not the most intuitive…
– A higher withdrawal rate means that amount you need to retire is lower
– A $1M portfolio at a 3% withdrawal rate provides $30,000 of income, whereas a 4% withdrawal rate would provide $40,000 of income (i.e., you could retire sooner using a 4% withdrawal rate)
– The big caveat is that a higher withdrawal rate is also more likely to cause you to run out of money in retirement (a point I raised in my post)
– The historical data indicates that 3% – 4% is ‘safe’; if you use a lower withdrawal rate, you will have a higher probability of retirement ‘success’, but it will take more time to retire
Or, in other words, a low withdrawal rate means you need more money to retire and that it will take longer to get there.
I hope this makes sense!
Hello! Thank you for this excel and all the other ones. I’m using several of them. I have a (hopefully) quick question about the “Retirement forecasting tool” tab. The section for “outputs and charts” has the chart in the middle cut off. I can’t seem to be able to change the zoom level so it all fits. Can you tell me how I can change it? Thank you.
Hi Sam, I’m happy to hear that you’re getting good use out of these tools!
That’s a strange issue — I just downloaded the excel version to test it out and everything looks OK to me. What version of excel are you using? And are you using Mac or PC?
If you still have issues, you could also try out the Google Sheets version of the tool which should work fine on all computers.
I hope this helps.
Thanks for the tool!
I’m a bit confused about the date/amount needed to retire calculation. Why does the amount needed in retirement increase if you withdraw a smaller percentage in retirement?
(cell C412 = C6/C7)
If you enter that you will take out 1% of the portfolio in retirement, the date moves further out, but if you take out a very large 50% of your portfolio each year, it says you can retire in a few years.
Am I using this part wrong, or is there an error?
Hi Josh,
The withdrawal rate concept is not the most intuitive.
A higher withdrawal rate means that amount you need to retire is lower. For example:
– A $1 million portfolio at a 3% withdrawal rate provides $30,000 of income, whereas a 4% withdrawal rate would provide $40,000 of income (i.e., you could retire sooner using a 4% withdrawal rate)
– The big caveat is that a higher withdrawal rate is also more likely to cause you to run out of money in retirement
– The historical data indicates that 3% – 4% is ‘safe’; if you use a lower withdrawal rate, you will have a higher probability of retirement ‘success’, but it will take more time to retire
In other words, if you used a 50% withdrawal rate, you’d be able to “retire” very soon, but it’s very likely that you’d run out of money quickly.
It’s recommended to only consider withdrawal rates that are roughly in the 3% to 4% range.
If you’re curious, a much more in depth explanation of safe withdrawal rates can be found here:
https://earlyretirementnow.com/2016/12/07/the-ultimate-guide-to-safe-withdrawal-rates-part-1-intro/
Thank you for the tools and I am looking forward to trying several out.
I downloaded the Retirement Tool and the chart buttons are not showing up on the Excel version. Initially, I thought it might be due to using Excel for Mac. However, I tried on a Windows machine but no luck. There is nothing but empty gray boxes. The Google Sheets version seems to be fine.
Hi Todd,
Thanks for flagging this. I just tested on my computer and it is working fine.
A couple ideas:
When you open the excel spreadsheet, did you “enable macros”? Usually there is a yellow bar at the top or menu in the sheet that allows you to do this
https://www.ablebits.com/office-addins-blog/2020/03/11/enable-disable-macros-excel/
If that doesn’t solve it, which version of excel are you using? Older versions may not support all of the features in that sheet.
As you mention, the google sheet version should work for all users.
Yes, I had enabled macros and my version is Excel for Mac v16.45 2019. Interestingly, I just deleted the old version and downloaded a new one and it is now working. Not sure what happened the 1st couple of times, but all looks good now.
OK great!
Hi there. Great tool. Three questions:
1. “Real returns after inflation”. If we assume 5% market returns and 2% annual inflation, we would enter 3% there. Correct?
2. I notice each year’s “investment return” is dividing the in-year contribution by 2. The implication there seems to be that the tool is assuming the contribution is being made mid-year. Correct?
3. Can you explain the rationale for using the e.g. 3% instead of 5% in determining annual investment returns? Shouldn’t inflation really only “matter” for spending? This approach seems to understate the investment returns (and thus, annual portfolio amounts) by quite a bit?
Hi Dylan,
Good to hear that you like the sheet! To answer your questions:
1 — that’s correct. You’d enter 3% (5% nominal return less 2% inflation).
2 — also correct. Spreadsheet assumes that contributions are made mid-year.
3 — when inputting your “annual expenses in retirement”, the spreadsheet assumes that this is an inflation-adjusted estimate of your retirement spending. So for example, if I assume I will spend $30K per year in retirement in today’s dollars, that actually might be $45K of nominal dollars when I actually retire in two decades from now.
The tool then calculates how large of a portfolio you need to sustain that level of spending in retirement.
In order to do an apples-to-apples comparison, we need to use an inflation-adjusted investment return assumption. This way, an inflation-adjusted portfolio amount will be used to sustain inflation-adjusted spending in retirement.
Put another way — both the portfolio amounts and spending amounts are being understated to show amounts in today’s dollars, instead of future dollars (which are larger amounts, because of inflation).
I hope this makes sense!
Thanks much. I see the tool holds spending constant. So the $30k in your example is applied as $30k every year (no inflation adjustments). So that’s “today’s dollars.” Then, we’re adjusting returns downward by an assumed inflation rate in order to also get the returns in “today’s dollars”. Makes sense.
I guess the lingering question is, if we were to do it the opposite way (use nominal market return rate and also adjust spending upward each year for inflation), would we get to the same outputs? Like if you had an extreme example of very high nominal returns and very low spending, does the math hold up?
(When I say “same outputs”, I mean x years to retirement, y% of amount needed for retirement, etc…I understand the $ values themselves would be tomorrow’s vs today’s)
Hi Dylan,
Yes your understanding of the tool is correct, and the math should hold up. I haven’t done testing myself, but conceptually it should still all work.
Hi,
Is the annual expenses in retirement a before or after tax number? ie: If my true expenses are $25,000/year in retirement, I will need to withdraw more than that per year to cover them + taxes.
– Ben
Hi Ben,
The annual expenses input should be a pre tax number (i.e., the larger number).
If you’re based in Canada, you can use this tool to estimate your taxes payable at different income levels.
https://themeasureofaplan.com/canadian-income-tax-calculator/
Hi,
The tool looks great but when I open it in excel I am not able to view the macros. Are they password protected? I would like to view the macros to make sure that the file is 100% safe from viruses or malware.
I would like to get together with you on funds to grow and invest.
Great work !!!!
the networth sheet and the retirement planning could be merged into one for checking if we are falling behind on monthly basis
[…] historical stock market returns can help to inform your financial plans, from planning for retirement, or figuring out whether it makes more sense to rent or buy your home. Plus, it’s plenty of fun […]
What a great tool! I don’t quite understand the relationship between withdrawal rate at retirement and the annual expenses in retirement. I presumed I will “spend” all that I withdrawal, so why the need for both?
Hi JS,
A higher withdrawal rate means that amount you need to retire is lower. This tool uses your “annual expenses in retirement” together with your “withdrawal rate” to calculate the amount of money required for you to retire.
For example:
– If you plan to spend $30,000 per year in retirement, and assume a 4% withdrawal rate, you will need a portfolio valued at $750,000 in order to retire (750,000 x 4% = 30,000)
– However if you assume a 3% withdrawal rate, you’d need a portfolio of $1,000,000 in order to fund the same $30,000 of annual spending in retirement (1,000,000 x 3% = 30,000)
– The big caveat is that a higher withdrawal rate is also more likely to cause you to run out of money in retirement
– The historical data indicates that 3% – 4% is ‘safe’; if you use a lower withdrawal rate, you will have a higher probability of retirement ‘success’, but it will take more time to retire
It’s recommended to only consider withdrawal rates that are roughly in the 3% to 4% range.
If you’re curious, a much more in depth explanation of safe withdrawal rates can be found here:
https://earlyretirementnow.com/2016/12/07/the-ultimate-guide-to-safe-withdrawal-rates-part-1-intro/
I put my retirement age at 60. However when I scroll down to the “Retirement Forecasting Tool”, Line 377 In-year contribution, it continues past the age 60. Is this correct?
It would also be great if you can merge the CPP/OAS calculator with this retirement date forecasting. Is there an option to calculate for couples?