May 26th, 2018 | Posted in Tools

Download the Investment Portfolio Tracker spreadsheet:
To make a copy: log in to your google account, click File –> Make a Copy, then save onto your own folder to create your own version). This spreadsheet — like everything else on this site — is completely free, and will always remain so.
[The latest update is now Version 8.9 — published on September 12, 2024, with improvements to make the Monthly Performance script more robust, and to add support for corporate spin-off transactions. If you’re using an older version and would like to upgrade, just open up a fresh version of the sheet, and paste in the info from your old “setup” and “trade log” tabs into the new version. Voila!]
[Previous versions have added features such as: letting you to specify a custom benchmark and see how your portfolio performance compares (many thanks to Alessandro Coscia for building this!), and the additions of the “Monthly Performance”, “Dividends”, and “Realized Gains” tabs.]
![]()
Welcome to your new portfolio tracker — the latest, greatest, and only tool you need to monitor your investment portfolio.
All investors — from the index couch potatoes, to the dividend aficionados, to the active day traders — need a tool to track their investment portfolios.
To measure your progress against your financial goals, you’ll need to have a strong grasp on how much money you have, where it’s invested, and how those investments have been performing.
This spreadsheet is easy to use but still comes packed with powerful features:
- Uses Google Finance formulas to automatically pull the current share price of your investments daily
- Calculates the $ and % return of your portfolio between any range of dates
- Comparison of your portfolio’s performance versus the S&P 500 index and any custom benchmark of your choice
- Dividend tracking
- Reporting on realized gains (super helpful during tax time!)
- Flexibility to group your investments into custom categories (e.g., domestic stocks, international stocks, bonds, etc.)
- Tracks assets in multiple countries, and converts all values into one common currency
- Automated re-balancing calculations versus your target asset allocation
- Supports up to 250 stock tickers, 10 investment accounts, 25 investment categories, and 5 currencies
And did I mention that this all comes free? Say goodbye to monthly subscriptions fees, paid premium features, and all that jazz.
![]()
Since I published this spreadsheet back in May 2018, thousands of DIY investors from all around the globe have used the tool, leaving comments such as…
“Thanks so much for sharing this. Took me an afternoon to rebuild 4 years of trading history over multiple accounts in different countries. This is really a great tool.”
“Awesome spreadsheet! This is exactly what I’ve been looking for months now!”
“This an amazing spreadsheet and by far the best I have come across so far. I can’t imagine the amount of effort that must have gone into making this so sophisticated.”
I hope that you’ll feel the same way 
Down below, we’ll do a detailed walk-through of the features, along with some tips on how to use the investment portfolio tracker.
Table of Contents
1) Spreadsheet Instruction Manual
- Setting Up The Spreadsheet
- Trade Log
- Your Portfolio Dashboard
- Monthly Performance Tracking
- Your Portfolio Holdings
- Dividend Tracking
- Realized Gains
- Re-Balancing
2) Tips & Tricks
Setting Up the Investment Portfolio Tracker [back to top]
If you haven’t done so already, open the investment portfolio tracker file:
Get the Google Sheets file
To make a copy: log in to your google account, click File –> Make a Copy –> save onto your own folder.
First up, use the “Setup” tab to customize this spreadsheet for your own investment portfolio.
This is where you can set:
- Your investment categories (e.g., domestic equity, international equity, bonds, REIT)
- Your investment accounts (TFSAs / RRSPs for Canadians, 401ks / IRAs for Americans, taxable accounts, and so on)
- The individual ticker symbols for the stocks and ETFs that make up your portfolio (AAPL, VTSAX, VXC, etc…)
A note for investors outside of the US: It’s a best practice to enter your stock tickers including the stock exchange symbol in front of it. Sometimes there is a different company in the US which has the same ticker, in which case google finance will pull the incorrect price. For example, for Bank of Nova Scotia (which is traded on the Toronto Stock Exchange), input the ticker TSE:BNS instead of just BNS (which is traded on the New York Stock Exchange).
To find the precise code to use, just use the search bar on google finance and copy the full ticker that’s shown there.
![]()
The Trade Log [back to top]
Once you’re finished with the Setup tab, move on to the Trade Log tab, where you’ll input your history of trades — with each transaction in a separate row.
Let’s take the example of an investor who buys shares of Microsoft (MSFT ticker) over time, then sells a portion of their holdings, and then receives a dividend.
This is what their Trade log tab might look like:
![]()
This investor bought 30 shares of MSFT in total, over three separate transactions (10 + 15 + 5).
Then, 12 shares were sold on August 21st for $213 per share. This leaves 18 shares remaining.
As shown on the last row, on September 10th a total dividend payment of $9.18 was received. This is broken down as 18 shares held, with a dividend of $0.51 per share paid.
When you’re entering dividend transactions, only the total $ amount is required ($9.18 in the example) — inputting the quantity of units and amount per unit is optional (18 shares held and $0.51 dividend per share in the example above).
A quick note on tracking cash positions and cash contributions: this tool was built to track your investments (shares held for stocks, ETFs, bonds, etc.), and doesn’t do any cash tracking by default.
Therefore, your trade log only needs to reflect when you buy/sell shares or receive dividends. No inputs are needed for when you add cash or take cash out of your account.
That being said, if you’d like to track your cash balances, please see below in the FAQ section about the $CASH workaround.
Inputting your history of trades into the Trade Log requires time and manual effort, but the reward and insights that you’ll get are just over the horizon!
I’ve got 8 years of trading history in my personal spreadsheet, and now that I’ve put in the work upfront, it just takes a few minutes per month to log new trades and dividends.
Your Portfolio Dashboard [back to top]
The spreadsheet will now handle the heavy lifting!
On the “Dashboard” tab, you’ll be presented with a summary of your portfolio.
At the top of this tab, you’ll find a few drop-down menus which control the outputs of the sheet.
The date cell (C2) determines the date at which your portfolio will be valued. By default, the sheet auto-updates for today’s value, but you can modify this to view your portfolio at at any other date in the past (e.g., at the end of last month or last year).
The currency cell (C3) tells the spreadsheet what currency you want the values to be summarized in. For example, I have this set to Canadian Dollars (CAD $) in my personal spreadsheet since I live in Canada. International investors can convert all values to their local currency with the click of a button!
The account filter cell (C4) allows you to filter all outputs by a specific investment account. By default this is set to show all accounts, but you can use this feature to drill down on the value and performance of any individual account.
![]()
The dashboard also shows pie charts for how your total portfolio value is broken down into:
- Individual holdings
- Investment categories
- Investment accounts
- Currency exposure
With this view, you can get a quick snapshot of the total value of your portfolio, and a view of how your investments are allocated.
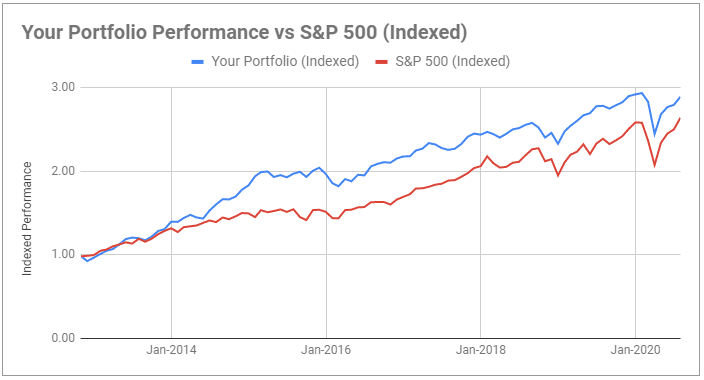
Scrolling down on the “Dashboard” tab, you’ll be able to track the performance of your portfolio over time.
Enter a ‘start date’ and ‘end date’, and you’ll be presented with an overview of how your portfolio grew from start to finish, along with the money-weighted return of your portfolio over that time period.
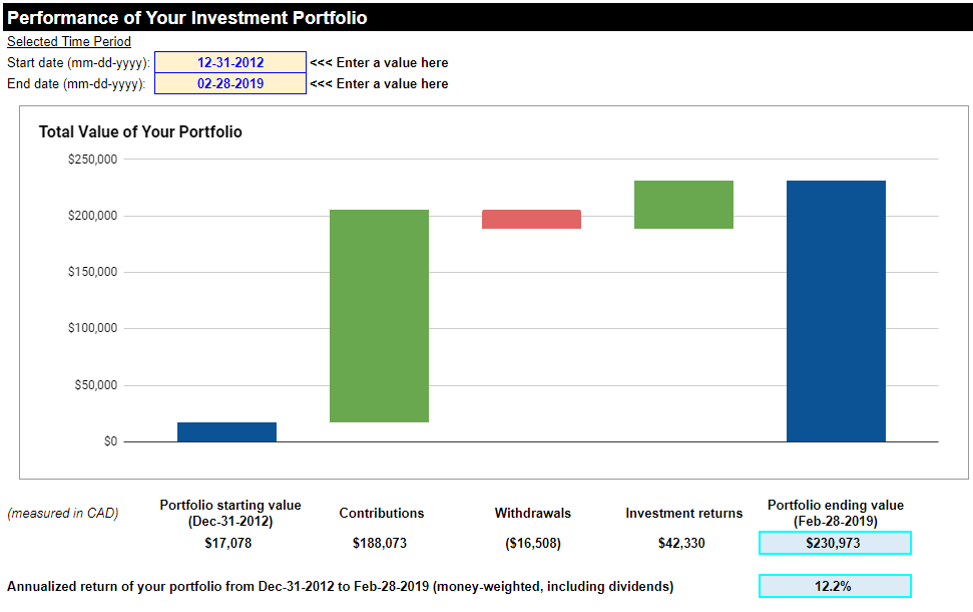
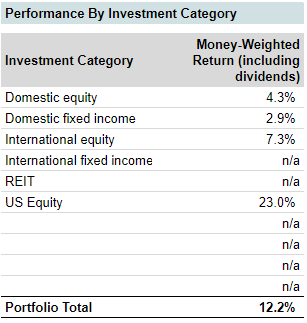
And just below that, you’ll find a breakdown of your overall portfolio performance by investment category.
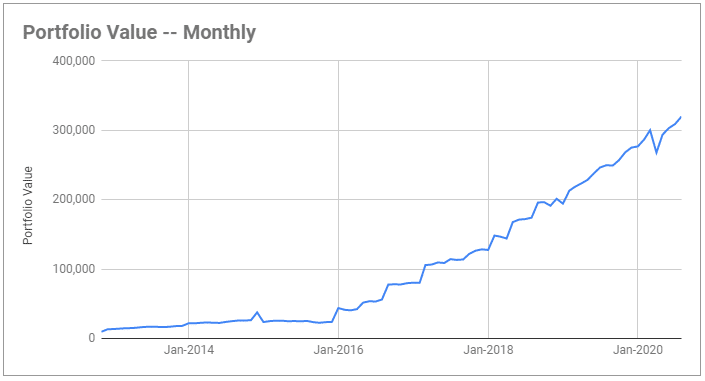
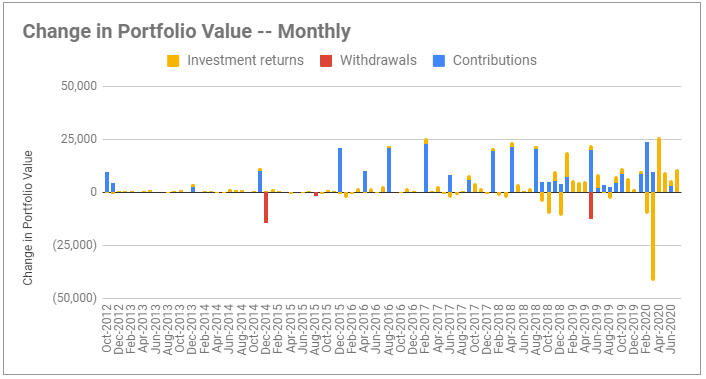
Monthly Performance Tracking [back to top]
The “Monthly Performance” tab gives you a month-by-month view of how your portfolio is growing, your investment returns, and also allows you to benchmark your performance against the S&P 500 index and a custom benchmark of your choice.
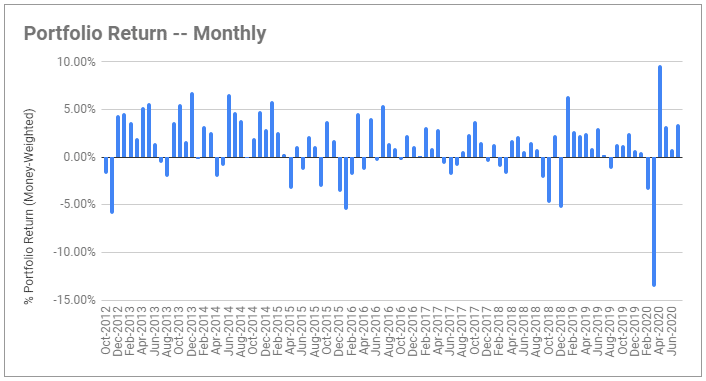
Follow the instructions at the top left, which will explain how to use this tab. It will require you to “authorize” a script to run in the spreadsheet. The tab uses a few lines of code to cycle through each month in your trading history and record your performance values.
Your Portfolio Holdings [back to top]
Digging one level deeper, the “Your Portfolio Holdings” tab shows details about your individual investments.
For each of your holdings, there is info on:
- The number of shares owned
- Your adjusted cost base
- Current market value
- Your unrealized gains
- Your dividends received
![]()
Dividend Tracking [back to top]
This tool will also give you a visual overview of your dividend progress over time.
You’ll find a trending report for the last 5 calendar years, and the last 24 months.
![]()
Realized Gains [back to top]
The Realized Gains tab shows your profit or loss on shares that have been sold.
Gains are calculated based on the price at which you sold, minus the adjusted cost base of your investment.
The spreadsheet can generate a realized gains report over any date range, and provides various summaries — by account, by category, by currency, and also shows the realized gain for each of your individual holdings.
![]()
Re-Balancing Your Portfolio [back to top]
To help you stick to your targeted asset allocation as time goes on, you can use the “Re-Balancing” tab.
After plugging in your target asset allocation values, the tool will provide you with a re-balancing plan to get your portfolio back in line with your ideal weightings.
In the example below, the spreadsheet shows how a contribution of $20,000 would be divided between your investment categories to re-balance the portfolio weights back to your target asset allocation. The results are shown in the cells highlighted in blue.
By default, the “allow for sells” assumption will be set to “No”. This means that the re-balancing calculations will not plan for you to sell any of your current investments in order to re-balance your portfolio.
I’ve set it this way since many people are reluctant to sell parts of their portfolio (preferring to re-balance by adding in new money), and also because selling your investments can trigger capital gains taxes.
If you’d like the re-balancing calculations to allow for sells, just switch the assumption to be “Yes”.
![]()
Troubleshooting Tips for the Investment Portfolio Tracker [back to top]
This spreadsheet pulls in the market value of your investments through Google Finance. Occasionally Google Finance will return errors for certain investment symbols or certain dates.
The “Dashboard” tab includes a warning at the top of the tab when it is detected that Google Finance is returning errors.
![]()
If you are running into this issue, please try the following:
- Refresh your browser
- Read through the FAQ section below — especially item #5 about using a new copy of the spreadsheet
- If none of that works, you can enter the prices of your investments manually on the “Your Portfolio Holdings” tab, in columns H, AF, and AL (look for prices that are appearing as zero, and manually input the correct price in the next column)
![]()
Frequently Asked Questions (FAQs) [back to top]
To keep track of regular dividends that are received as cash:
- Enter a “dividend” transaction on the Trade Log tab, where you input the date, ticker, total $ amount, and investment account where the dividend was received
- It’s not necessary to enter the quantity of shares or amount per share (however, no issues if you do want to enter this extra info) — just entering a total amount in column G is sufficient
![]()
To input dividends that are reinvested into new shares (a “DRIP” strategy):
- Enter your dividend as two separate transactions. One transaction is the regular “dividend” transaction, and the second transaction is a “buy” transaction to record the purchase of additional shares
- For example, assume you get a dividend of $20 which was reinvested into 4 new shares of XYZ Corp. Enter two transactions: a “dividend” transaction where you receive a total amount of $20, and then a separate “buy” transaction where you buy 4 new shares of XYZ for $5 per share
- The spreadsheet will now record that this dividend has been reinvested to purchase additional shares of XYZ
![]()
Please go to the google finance website (https://www.google.com/
Then, use that full ticker symbol in the investment portfolio tracker, on the Setup tab. Make sure that you delete any spaces in the ticker name.
For example, for the Bank of Nova Scotia company on the Toronto Stock Exchange, enter “TSE:BNS” instead of just “BNS”.
For any stocks or mutual funds which don’t appear on Google Finance, you can do the following in order to have them included in your total portfolio:
- Add a new holding on the Setup tab — any ticker is fine as long as it isn’t an actual ticker on google finance (for example, “$TDB900” for the TD e-series 900 Canadian Index fund)
- Then, use the manual price entry columns on the Your Portfolio Holdings tab (columns H, AF, AL) — since Google Finance won’t return a price per share for these tickers automatically, the spreadsheet will use these manual entry prices instead
Now, the Dashboard tab will show these stocks or mutual funds in your total portfolio value.
Similar to the answer above, try entering the full google finance ticker for the company, including the stock exchange symbol.
For example, for the Bank of Nova Scotia company on the Toronto Stock Exchange, enter “TSE:BNS” instead of just “BNS”. There is another company with the ticker BNS that is traded on the New York stock exchange, so google finance gets confused if you don’t enter the full ticker.
If the market prices still look wonky, go back to the Dashboard and check the date cell (C2). All of the market prices will be pulled as of that date, so much sure that it’s set to the date you want to see!
Absolutely! This investment portfolio tracker can be used by investors in any country. The spreadsheet even allows you to track investments in multiple currencies (up to five), all in one place.
For the calculations and outputs in the spreadsheet, all amounts are converted into a single common currency based on the currency that you select at the top of the Dashboard tab (cell C3).
So, if you now select GBP (British Pounds), all values will now convert to GBP. Likewise for CAD, USD, JPY, etc…
If something just seems off in the spreadsheet — values of “n/a”, “#REF”, or “Error” for example, it’s possible that some formulas were broken accidentally as you inputted your data.
The best way to proceed is to open a fresh copy of the spreadsheet.
Once you’ve done that, copy the values from the “Setup” and “Trade Log” tabs of your old version, and paste them into the fresh spreadsheet.
9 times out of 10 this does the trick!
This spreadsheet calculates the total return of your portfolio over any given time period — including realized gains, unrealized gains, and dividends.
Go to the Dashboard tab, and scroll down to the Performance section. Once you enter a start date and end date, the spreadsheet will calculate the “money-weighted” return of your portfolio.
The money-weighted return is equivalent to the “internal rate of return” (or IRR) of your portfolio. This return calculation captures portfolio contributions, withdrawals, realized / unrealized gains, and dividends received.
If the time period you’ve entered is greater than 1 year, the result will be shown on an annualized basis. As an illustrative example, the tool would show a return of 7% per year instead of a total three-year return of 22.5%.
If the time period you’ve entered is less than 1 year in length, the result will not be annualized. For example, if your portfolio has earned a return of 5% over 3 months, the spreadsheet will show a return of 5%, rather than an annualized value of 21.6% (which would be misleading in my opinion).
By scrolling further down in the Performance section, you’ll also find the money-weighted returns shown for each of your custom investment categories. This allows you to compare the relative performance of different groups of investments (e.g., U.S. stocks, Canadian stocks, bonds, etc.).
Please note that the spreadsheet does not calculate the money-weighted return of individual stocks at this time.
However, you can view the unrealized gains and dividends received per stock over the life of the investment on the “Your Portfolio Holdings” tab.
You can also view your realized gains per stock on the “Realized Gains” tab.
This tool wasn’t built to track cash. However, if you do want to keep tabs on your cash balance as well, you can try this workaround:
- On the “Setup” tab, add a new stock ticker called $CASH (or something else that doesn’t return a market value on google finance)
- Whenever you get extra cash in your account — dividends, contribution, etc., enter in a buy transaction on the Trade Log where you purchase X shares of cash at $1 per share (X being the total amount of added cash)
- Then, on the Your Portfolio Holdings tab, in the manual price entry columns (H, AF, AL), input a value of $1 per share for your $CASH investment
- Now, you’ll see your new ticker $CASH, and the corresponding total $ amount reflected
- If you use up that cash, remember that you’ll have to enter a corresponding sell transaction
I’ve written a script (a.k.a., a few lines of code) that runs when you click the “Go!” button.
This allows the spreadsheet to cycle through each month in your trading history and record the performance of your portfolio — starting value, contributions, withdrawals, investment returns, and the ending value.
Specifically, the script will copy the numbers in row 76 of the Dashboard tab, and then paste those values into columns N to T of the Monthly Performance tab.
Please note that these numbers are “pasted as values”. Therefore, they will not update if you add new transactions to the trade log that impact a prior month.
If you do update your trade log to reflect new transactions in prior months, you just need to delete the numbers found in columns N to T (delete only the data, not the columns themselves), and then re-run the script.
Yes! The spreadsheet can handle stock splits and reverse splits swimmingly.
To enter a split transaction, you need to input the following information in a row on the trade log tab:
- Date when the split occurred — in column B
- Transaction type of “Split” — in column C
- Stock ticker — in column D
- Split Ratio (new shares per old share) — in column J
You can leave columns E through I empty.
To illustrate with an example, let’s assume that you purchased 10 shares of Apple (AAPL ticker) on August 1st, 2020, for $415 per share.
Apple subsequently split its shares on a 4-for-1 basis on August 28th, 2020.
This means that you hold 40 shares after the split, given that you purchased 10 shares initially, and then the split occurred, giving you 4 new shares per 1 old share.
To reflect this on the trade log, you would need to enter two rows of data — one BUY transaction, and one SPLIT transaction:

Now, when you flip to the Your Portfolio Holdings tab, you’ll see the correct values:
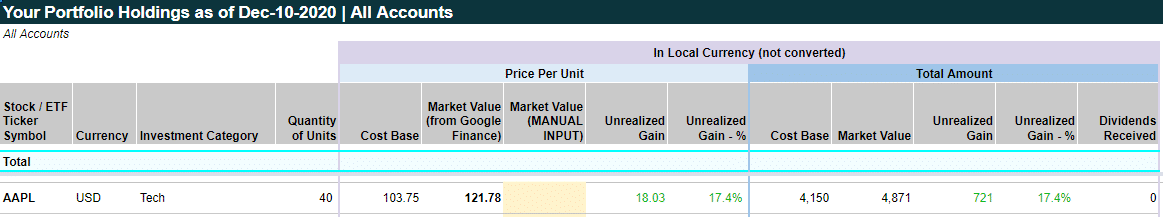
Notice how you now own 40 shares of AAPL, and have a cost base of $103.75 per share — this is because your initial cost base of $415 per share was divided by 4 after the split occurred.
When you enter a split, you can leave column I (Investment Account) blank.
You only need to enter a split once even if you hold the same ticker in multiple accounts — it will automatically be applied across all accounts when you enter it once on the trade log tab.
In some cases, companies will perform a “reverse” split, where your number of shares will decrease after the split. This should be handled in the same way, where you enter the appropriate split ratio in column J.
For example, if a company does a reverse split on a 1-for-10 basis (1 new share per 10 old shares), you can enter either “0.1” or “=1/10” in column J. The two methods are equivalent.
Unfortunately not.
For those keeping score at home, you’ll know that I have a preference for excel over Google Sheets. However, I haven’t been able to find a reliable way of getting current and historical stock/ETF price data to import automatically into excel.
While Office 365 has a new “Stocks” feature that lets you import real-time stock prices into excel, this unfortunately doesn’t work for historical prices (yesterday, last month, last year’s price, etc).
This spreadsheet uses historical pricing info to calculate portfolio performance between any two dates, so historical prices are a critical input.
Yes they are! This spreadsheet tracks crypto currencies in the same way that it tracks more traditional stocks and ETFs.
On the Setup tab, input the ticker as the label for the crypto currency (e.g., BTC), followed by the label for the currency that it is priced in (e.g., USD). So, if you buy bitcoin with US dollars, the code is “BTCUSD”.
In the screenshot below, I’ve shown the tickers for Bitcoin and Ethereum, first priced in US dollars, then priced in Canadian dollars.
![]()
Next, use the trade log to input your transactions as usual.
![]()
Now, the spreadsheet will track your crypto currency investments and will include them in your total portfolio value, asset allocation, and all performance calculations.
![]()
Yes — the spreadsheet does support fractional / partial shares. Here’s an example portfolio showing an investor buying 0.4 shares of Apple and 0.8 shares of JP Morgan.
If you flip between the Trade Log, Dashboard, and Your Portfolio Holdings tabs, you can see the calculations properly reflected.
In your spreadsheet, you’ll just need to increase the decimal points shown in the columns where the spreadsheet shows the number of shares you hold (I did this in the example I created). As it stands, the spreadsheet shows 0 decimals by default, but you can easily show more decimals by using the toolbar at the top of the sheet.
By default, the spreadsheet is set up to accept dates in MM-DD-YYYY format. For example, February 15, 2021 would be inputted as 02-15-2021.
To change the date formatting to your liking, you can update the format manually in the Trade Log by selecting the cells in the Date column, then Format > Number > More Formats > Custom Number, and then type in your preferred format — e.g., DD-MM-YYYY or YYYY-MM-DD.
You can use this process for any and all other dates cells as well — e.g., at the top of the Dashboard tab.
This tool was built with fairly ‘vanilla’ investors in mind (buying individual stocks / ETFs), so unfortunately it does not handle options or derivatives well.
However, you can try this workaround:
– Add a new ticker symbol on the Setup tab (for example, AAPL-CALL if you are buying calls on AAPL)
– When you buy a call, add a buy transaction on the AAPL-CALL ticker, reflecting the premium paid
– When the call is exercised or expires, enter a sell transaction on AAPL-CALL at the price at which you sell ($0 if the option expires)
The price of this ticker won’t be tracked in real time since google finance does not recognize the ticker, but once you close your position out, the returns will be reflected in the spreadsheet’s performance calculations.
ETFs can give “distributions” in a few different forms. Depending on the type of distribution, there will be different impacts on the adjusted cost base of your investment / different tax consequences.
Here are some good guides for understanding fund distributions:
This spreadsheet allows you to enter various transaction types on the Trade Log — including dividends, return of capital, reinvested capital gains distributions — and will adjust your adjusted cost base accordingly.
Final Thoughts [back to top]
I hope that you’ll get good use out of this investment portfolio tracker. If you have any questions or feedback, please leave a comment below or send me an email at themeasureofaplan@gmail.com.
I’ve gotten amazing feedback on the spreadsheet from investors from all corners of the globe, and I’ve been improving the spreadsheet with new features and outputs on a regular basis (see the change log tab for more details).
When I upload a new version of the spreadsheet, you’ll see a little red box notification at the top of your “Instructions” and “Dashboard” tabs. You can also simply check this page every month or two to see if anything is new.
And that’s a wrap — cheers to good health and growing wealth!
P.S., if you’d like to show your appreciation for this spreadsheet, you can buy me a coffee or beer by clicking the little blue button below
—
Header image credit: The Sacramento Bee
—
 Support The Measure of a Plan
Holy moly this is incredible! I love having all my investments in one place and being able to see the current value without manually plugging in the stock prices myself.
Thank you so much!!
Hey Sam,
That’s awesome to hear! Thanks for sharing.
I will definitely check out your spreadsheet, it looks like it might be very helpful and build on my own spreadsheet.
I have been using this method to get my stock quotes from Google Sheets into Excel. The only downside is the manual step of “refreshing all data” to get the latest stock quotes.
https://www.vertex42.com/ExcelTemplates/excel-stock-quotes.html
Hi Dan, thanks for the heads up on that query method.
Unfortunately this spreadsheet is a little bit more complicated than that; information would need to be passed both ways (from the excel sheet to the google sheet and vice versa), as opposed to only from the Google sheet to excel as outlined in your link.
The reason is that this spreadsheet calculates portfolio returns between two selected dates (both dates can be changed). As such, the excel file would need to pass date info to the google sheets file, and then the resulting stock prices would need to be passed back to excel.
It’s a shame that excel discontinued their direct stock price lookup feature…
I am having a problem with one stock symbol TCAP google finance enters a price that is not correct much higher than the price quoted by other services. tried refresh, exit and reload, reboot, etc. can this be resolved? I sure hope so because this is exactly what I have been looking for… Thanks so much for your effort…
Hi James,
Is the company you are looking for named “Triangle Capital Corp”? That company appears to be called “Barings BDC” now. Google Finance lists the ticker for that stock as BBDC as opposed to TCAP. Perhaps the ticker changed…
Can you try BBDC and see if it works?
In general, the best way to make sure the ticker is correct is by searching for the company at google.com/finance and plugging in the ticker that Google uses. Sometimes companies change tickers, sometimes you need to add the full ticker (NYSE:BBDC) because there is a company on the Toronto or London stock exchange with the same ticker.
Hope this helps.
Problems solved quickly. Faster than any support resolution that I have experienced…
Cheers, glad to hear it Jim!
Thank you. That was the problem. Two other questions if you have time… 1. The totals line on portfolio holdings sheet (line 56) does not show any totals.. 2. The dashboard page doesn’t work. A lot of “#N/A”. Thanks so much. Jim
Hey Jim,
Sorry to hear that. Have you read through the Troubleshooting Section of this post? There are a few things you can try there. Is Google Finance populating market values for all of the stocks that you’ve entered? Perhaps one of the ticker symbols you entered is incorrect.
You can send me a screenshot by email, or better yet share your spreadsheet with me so that I can take a look at what is going on.
Cheers.
Thanks so much for this great spreadsheet! I love it.
Just one questions though: In the trade log I have entered the dividends received. They just don’t sync into my portfolio holdings page as dividends received. Do I need to manually input the values on the portfolio holdings page? Also, are dividend received not reflected on the market value of the Dash Board? If no, where should I best look for my current net worth of my investment?
Once again, thank you so much for this lovely spreadsheet and your time for answering our questions.
Jerry
Hi Jerry,
Glad to hear that you’re getting good use out of this spreadsheet.
Here is how the tool treats dividends / how dividends are factored into returns:
Your dividends received are also shown on the “Your Portfolio Holdings” tab (in column Y). On this tab, the unrealized gains for each of your holdings are calculated based on the market value of your investments as of the date value you select on the Dashboard, minus the cost base of you investment.
For the calculation of your investment returns over time, dividends are treated as ‘contributions’ to the portfolio to the extent that the cash your received was used to buy new investments.
For example, if you receive $100 in dividends, and use that to buy a few more shares of a stock, this money will be treated as a contribution to your portfolio, and will also be reflected in the value of portfolio at the end of the time period. If you do not re-invest this money, it will not be included in your portfolio.
To log dividends correctly in the “Trade Log” tab:
For regular dividends (without DRIP), you should just enter them as a dividend transaction.
For dividends that are re-invested, enter them as two separate transactions. One transaction is the regular dividend transaction, and the second transaction is the purchase of additional shares.
e.g., let’s say you get a dividend of $20 which was reinvested into 4 new shares (implied current price per share of $5). You’d enter a dividend for $20, and a separate ‘buy’ transaction of 4 new shares being bought for $5 each.
This way, your DRIP investment will be tracked properly since your share count will match what you actually have.
I hope this helps!
That’s very clear explanation, thank you very much. I was thinking ‘hmm, where are my dividends gone?’, without thinking that it could be treated as a re-investment.
Big help indeed!
I’d appreciate if you could explain a little bit more because I am not convinced that dividends are correctly treated in your tool. I am not a financial professional so that might be because I missed something…
To me, dividends contribute to the performance of the portfolio. For example, if one share of a stock is worth $100 on Jan 1st and $110 on Dec. 31st and it distributed $10 of dividends, then the returns are +$20 (or +20%). In your tool, I don’t see how dividends are included in the calculation of returns. I don’t think dividends should be treated as contributions because even though they are reinvested, this is not new money transferred in the portfolio. Currently, your tool treats my dividends as if I transferred new money (contributions) in my investments, thus diminishing my returns.
Another example, if I buy 5 shares at $20 each on Jan 1st (portfolio value = $100) and it still $20 each on Dec 31st, but I received $20 dividends on June 30st that I reinvested in one share. Your tool will give a return of 0 while it should actually be +$20. My portfolio cost me $100 from my pocket and it is now worth $120.
Your tool is very helpful and I thank you for sharing it but I can’t use it if I am not fully convinced with the returns it provides. I hope you’ll will have the time to explain me how it works!
Hey Gloubo,
I still re-iterate what I mentioned to Jerry above about how to log your dividends / reinvestment of dividends. However, you make a good point about the returns.
The return calc should factor these in.
I’m a bit busy currently, but I’ll adjust the tool and update you when it is tweaked!
Thanks for pointing that out.
EDIT: As of Dec. 8, 2018, this update has been made and released in version 3.
I want to second that post and that dividends contribute to the performance of the portfolio. It would be great if a future update is created to accommodate for this.
I also second that the spreadsheet is great and very useful. A big THANK YOU for creating!
Thanks FS.
I’ve just released an updated version 3 of the spreadsheet that factors dividends into the return calculation.
Cheers!
Thank you, it works and I love how easy it is to “upgrade” to the new version – only a few copy & paste actions.
Cheers, glad to hear that.
For those who aren’t as spreadsheet savvy as FS, if you are on an older version and want to ‘upgrade’, just copy and paste your data from the “Setup” and “Trade Log” tabs from the old version into the new version. Voila!
Hey Gloubo,
Version 3 of the spreadsheet has now been published. The money-weighted return calculation now factors in dividends.
Thanks again for pointing that out!
This is great! Thanks for the quick update.
Quick question. If I have a previous version the only way to update is to change the file I guess? I’m asking because I made few personal updates as well after I copied the file and It might be hard remembering what I tweaked.
On an unrelated note. It’d be great if you can keep a change log like (https://keepachangelog.com/) to keep track of all the different changes and version
Again keep up the great work!
Thanks Alex.
To move over to a new version you just need to copy & paste the info from your “Setup” tab and “Trade Log” tab into the new version.
Unfortunately you’ll need to replicate your custom tweaks (formulas, charts, etc.) if you want to carry those over.
Re: the change log, great idea. I will do that.
Awesome work! Just a question — and I’m not sure if a bug or stupidity on my own part or what.
I have holdings of the same symbol in two of my accounts (different amount of shares). But in the “Your Portfolio Holdings” sheet, it shows up twice as expected but both entries have the combined number of shares. To word it more precisely, if the combined amount of shares is (80 in account A + 20 in account B=) 100, both entries in that sheet have 100 shares. And I’m almost sure this is thus recording double how much I hold of this category and such.
Is there a way to resolve this?
Hi Luis,
On the “Setup” tab, have you entered in that same symbol twice in the “Portfolio Holdings” table? If so, please delete one of those entries. The intention is for you to enter unique symbols in that table, otherwise it will double count as you mention.
The “Your Portfolio Holdings” tab will then show the combined 100 shares in one row, but only once. The tool won’t be able to show the 80 shares on one row, and the 20 shares on another row if it is the same symbol you own.
Let me know if that helps!
You’re absolutely right. That was a silly mistake.
Hi, I haven’t started using your spreadsheet, but like to ask if there’s a way to add in more currencies?
cheers
Glenn
Hi Glenn,
You can use whichever currencies you want (just need to change the symbols on the Setup tab), as long as you respect the maximum of 5 currency symbols in total. It isn’t currently possible to enter in more than 5 total currencies.
Thanks so much for sharing this.
I have entered my trades – which aren’t that many. However, an issue arises when I enter the following trade:
LON:TSCO – 500 @ 2.23 GBP.
The set-up tab shows the correct total – $1,115. Yet, when I look at the Dashboard, the value of this stock is then inflated 100x to $105,00. This would be great if that were true but sadly that’s not the case.
It is probably to a set-up option – where one is in cents/pence, the other is in dollars/pounds.
Any idea how I fix this?
Many thanks
Hey Damian,
I scrubbed through the file this morning. I think I’ve made the fix. Can you please try opening up a fresh version of the spreadsheet, and then re-pasting your old Trade Log into the new spreadsheet?
I’ve tweaked the formulas so that if a stock is in GBP, that the price from Google Finance is then divided by 100. Issue is that most stocks report the price in dollars, while British stocks are in pence.
Let me know if this works.
PS – unfortunately there’s no way to easily format all the currency as the pound symbol instead of the dollar symbol depending on what the user selects, so you’ll just have to mentally note that the figures are in GBP even though a $ symbol is showing up…
Thanks for the new version of the spreadsheet – and sorry for the delay in getting back to you. At first glance, the new version divided all my investments by 10 – so I simply reverted to the previous version, and left off the TSCO stock, for now, And the previous version works a dream. I will take a closer look at the spreadsheets later this week and get back to you. But thanks again for your help.
How can i add in KLSE stock in my portfolio? Google sheet doesnt seem to recognize it despite i’m able to find it on Google Finance (Eg. PBBANK:KLSE)
Hi Jerry,
I just tried on my end as well (KLSE:PBBANK) and it returned an error. After some googling around it seems that Google Docs cannot access price data from certain stock market exchanges for some strange reason — even though it shows properly on Google Finance. The Malaysian market KLSE seems to be one of those.
See here…
https://productforums.google.com/forum/#!topic/docs/HDnOnJc8MRE
Unfortunately there doesn’t seem to be a work-around that Google has proposed. Sorry about that.
Awesome spreadsheet! This is exactly what I’ve been looking for months now!
Just a quick question.
How is the total Contribution calculated on the Dashboard sheet? I assumed is the sum of all “Buy” transactions in the Trade Log, but by calculating the sum manually on the log sheet, I get a slightly different value (1% short) from the one in the Dashboard. Not sure why.
I checked all the functions too. Am I missing something?
Thanks in advance for the help! And again. Awesome job!
Hey Alex,
Glad to hear you found what you’ve been looking for.
To your question — in your trade log have you invested in assets in more than one currency? The trade log column G is the total amount of your trade in “local” currency (e.g., in CAD if a Canadian stock, and in USD if an American stock). However, when you go to the dashboard, everything has been converted to one common currency.
For the overall concept you are absolutely right — the total contribution amount should be equal to the sum of all your buy amounts.
Let me know if you’re still having an issue reconciling.
Really great tool ! Would you consider adding the time weighted returns in the dashboard?
Hey again Gloubo,
Time-weighted returns are more complicated given that it would require a recalculation of the entire portfolio value at each date at which money is added or withdrawn from the portfolio. This means Google Finance quotes would need to be pulled for each holding.
The spreadsheet is already quite slow, so unfortunately I don’t want to burden it further.
Thanks for the comment.
I use a simplified method where I just input the portfolio value once a month when I receive my monthly statement. This is especially useful to benchmark against index.
Hi Thanks for the spreadsheet. I am trying out for the first time. when I input a stock (Genting Singapore Ltd G13) the Valid Symbol on google finance ? returned a #N/A. The command says, Not authorized to access data on exchange. Can you help ?
Hi Law,
It seems that Google Docs cannot access price data from certain stock market exchanges for some strange reason — even though it shows properly on Google Finance. The Singaporean market SGX seems to be on that no-go list.
See here…
https://productforums.google.com/forum/#!topic/docs/HDnOnJc8MRE
Unfortunately there doesn’t seem to be a work-around that Google has proposed. Sorry about that.
Quick tip that I’ve found useful.
For each holding that’s not on Google Finance I just import the quote from Bloomberg with the following function.
=IMPORTXML(“https://www.bloomberg.com/quote/”&B7,”//*[contains(@class,’priceText’)]”)
Where B7 is the “Bloomberg Symbol” of the holding you’re looking for. In case of “Genting Singapore Ltd G13” it will be G13:SP.
The drawbacks are
1.If you want to update the function and the quote you need to reload the file (I believe Google Finance pulls automatically the quote every 20 min or so)
2. When Bloomberg will decide to redesign their site, most likely the function will return an error. This is will happen when the HTML class of the element containing the current price quote is renamed to something different from “priceText”
Let me know what you guys think.
The IMPORTXML function is awesome but requires some knowledge of HTML to find the data that you need on every webpage.
Very cool, thanks for pointing this out Alex.
Do you know if you can use IMPORTXML to get historical price data from Bloomberg (e.g., ability to pull the closing price as of any previous date)?
This investment portfolio tracker needs to be able to do that to calculate portfolio returns, given that you can enter a start and end date and get the return for that period.
Not sure if this function can do that.
I just use it to override all the manual inputs in yellow and speed up the process instead of going online and looking for the day’s market value.
MPORTXML takes a snapshot of the current state of a web page when invoked and retrieves a specific value determined by a specific HTML attribute. It can’t store this specific value or go back in time unless Bloomberg (or any other site) stores already these historical values and renders them all on a page.
Hope that helps.
Good to know. Cheers!
Hi,
Thanks you for this tools, great job.
I’m trying to use it with investment in two different currency.
In the dashboard, i guess there’s a currency conversion to CAD ? What is the rate/source ?
Do you think I should create two different portfolio sheet for the two currency ?
Cyrille
Re,
It’s ok, found everything I need to know.
Again great Job.
Cyrille
Thanks Cyrille, you’re making my job easy
I will respond to your questions anyways, in case this will help other users.
Yes, if you have investments in multiple currencies, these will all be converted to your selected common currency on the dashboard. The source for these currency exchange rates is google finance. If you go to the “Your Portfolio Holdings” tab in column AA, you can see the rates that are used. These are pulled as of the date you select on the dashboard.
I recommend that you track all your investments in one spreadsheet, it will be easier that way. Personally, I have investments in both CAD and USD, and I track everything in this one sheet.
Cheers!
Hi,
Though I find your sheet very helpful, I am trying to tweak it to give me a portfolio of only a single asset class (domestic India Equity) for a single currency (INR), which I also want to balance to target allocations given a list of ~ 40 individual stocks. What is the best way to do this?
I am also unable to figure out how you incorporate splits/bonuses (I don’t know what the input data format is for splits/bonuses in the Trade Log sheet), since the quantities/prices in the Trade Log sheet aren’t automatically updated for splits post the initial purchase dates.
Thanks
Hi RK, thanks for the message.
Everything is customizable on the “setup” tab, so you can set up the asset categories as you wish. For example, you could bucket your 40 individual stocks into 6 industry groups (e.g., tech, energy, healthcare, consumer staples, etc.). Up to you.
To enter in stock splits, just add this as a new transaction row. Select “Split” in column C, select the stock ticker which is relevant, and then enter the split ratio in column J (new shares per old share). e.g., if your share count has doubled, enter in a value of 2.
Any previous transactions for that stock will be automatically adjusted on the “Dashboard” and “Your Portfolio Holdings” tab. Note that the trade log itself is not adjusted, but all calculations for that stock are adjusted so the figures are correct.
For example if you purchase 4 shares on Jan. 1st, and then split 3-for-1 on Feb. 1st, the tool will consider that you own 12 shares now. Again, this is shown on the Dashboard and Your Portfolio Holdings tab, not the Trade Log tab. The trade log tab is meant to be an input tab only, not an output.
Great tool–thanks for sharing!
My roboadvisor does automatic Tax Loss Harvesting. This makes my Contributions and Withdrawals look out of whack. What edits would you suggest in order to account for TLH so that the Performance graphs have more meaning?
Similarly, I saw your comments here and on Reddit about reinvested Dividends showing up in the Contributions. Any ideas or plans to change how reinvested Dividends are represented in the Performance?
Hey Nukem,
Tax loss harvesting is a tough one. I’m assuming that your performance charts show very high contributions and withdrawals given that positions are sold and then the money is re-invested.
One thought would be to record your robo-advisor position as a single aggregate investment. i.e., instead of recording each of the underlying investments that the robo-advisor holds, just record the total amount. This way, the performance figures would have more meaning.
The downside would be that you’d need to manually record the price info (see the “Your Portfolio Holdings” tab), and you wouldn’t be tracking the granular data on holdings.
On reinvested dividends, those are now accounted for properly in the calculation of returns. They still show up as contributions, but they now count towards performance.
Hey,
Awesome… Really great spreadsheet… Thanks for sharing it!
Hey Arcadi,
Glad to hear it, thanks for letting me know!
hey,
Thanks for sharing this. Really great work.
For fixed income assets like GICs or Term Deposits…
1) if an investment was purchased on Day0 for $10,000, do you recommend putting “$1” for “$ per unit” and “10,000” for “Quantity of Units” upon purchase?
2) and the investment was sold on Day1 for $11,000 on Day1, you’d put “$1.1” for “$ per unit” and “10,000” for “Quantity of Units” upon purchase?
Is this the best way to approach it with this spreadsheet?
– what’s the best way to account for idle cash in this spreadsheet?
– in what situation would you use “Return of capital” for a Transaction Type in the trade log? Are you able to walk through an example and how it impacts the return calculation?
Hi Chris,
For GICs / term deposits, the method you describe would work. You can also input it as 1 single share (e.g., you purchase 1 share for $10,000 per share initially, and then later sell the investment for $11,000 per share). Whichever you prefer.
I use this tracker purely for my investments in stocks and bonds, so there’s no automated tracking of cash here. However, one workaround is to add a investment called “Cash” on the Setup tab, and then add “buy” or “sell” transactions on the trade log to reflect changes in your cash balance.
For return of capital transactions, here is an overview of what they are: https://investinganswers.com/financial-dictionary/investing/return-capital-roc-914
Your brokerage account statements should tell you when these transactions have occurred.
ROC transactions impact the investment returns similarly to how a dividend would be treated — they increase your money-weighted return. For example, if you buy an investment for $100 on Jan. 1st, the investment grows to $110 by Dec. 31st, and you receive a $5 return of capital during the year, your return for the year would be 15%.
Awesome spreadsheet!! Has everything I’m looking for in one place the only thing I can’t seem to find or figure out is my gain or loss for tax purposes for each stock bought and sold in a particular year (Short Term or Long Term Gain). Am I missing something or is it possible to add another Tab (Tax Exposure) at the bottom similar to Your Portfolio Holdings but for Realized Gains/Losses to reflect tax exposure for each stock bought and sold in a given tax year, or perhaps another column showing the tax data in Your Portfolio Holdings. Thanks again for creating this awesome tool!
Thanks for the comment Kim.
You are not missing anything — unfortunately this tool doesn’t contain any tax calculations at the moment.
On the “Your Portfolio Holdings” tab, you can see the unrealized gains on all of your holdings (e.g., your profit / loss on your current portfolio). Note that these are unrealized gains, so they do not take into consideration positions that have been sold.
A workaround that you can use now is to set the date on the dashboard to be the day before you sold a position. Take note of the adjusted cost base per share of your investment at that date. Then, use that ACB per share to calculate your capital gain/loss based on what you executed the trade at (for example, if you sold at $30 per share and your ACB per share was $20, you have a capital gain of $10 per share).
The complication with adding in automated tax calculations is that the adjusted cost base of the investments would need to be tracked separately for taxable and non-taxable accounts. For example, if you hold the same investment in both a TFSA and a regular taxable account, your adjusted cost base for tax purposes should exclude the TFSA.
As it stands, this tool aggregates all instances of the same investment ticker into one row.
At first glance, this would be a relatively complicated change. If I release another version of this tool, I will try to add in this feature.
Thanks for the reply. Appreciate the info.
Interested in utilizing this spreadsheet. Would this be able to capture the diversification of my mutual fund holdings?
Hi Mayor,
This tool uses google finance to grab the current market values, so if you’re able to find your fund here: https://google.com/finance, then it should work in the tool.
If that doesn’t work, you’d have to manually enter the NAV per share of your mutual funds into the tool.
What does that mean? (pardon my ignorance, I don’t use Google Sheets or even Excel). For example, Tangerine Equity Growth Fund (INI240) isn’t pulled by Google Finance. How does one enter the price manually under the NAV?
Hi DR,
The Net Asset Value (NAV) per share of a mutual fund is the current market value of one share of the fund.
For your Tangerine fund, you can find the NAV per share online, for example: https://www.theglobeandmail.com/investing/markets/funds/INI240.CF/
Your fund has a NAV of $19.68 per share as of April 26, 2019.
Since this spreadsheet tracker isn’t able to automatically find and input this value for you (since it is not available on google finance), you would need to manually input the values yourself.
You can do that on column H of the Your Portfolio Holdings tab in order to calculate the current value of your portfolio.
If you want to do performance tracking, you’d also need to input the values in columns AE and AJ of the same tab.
Thank you for the spreadsheet! How can I get the TSX symbol/price? If I enter for example BNS, I get the price in US $ Iin the portfolio tab. Thank you
Hi Ed,
If you enter “TSE:BNS” as the ticker on your Setup and Trade Log tabs, this will grab the Canadian price instead.
In general, adding the stock exchange (TSE / Toronto Stock Exchange in this case) before the ticker would be a best practice.
Hi , What a fantastic spreadsheet one of the best i have used for a long time. Thank you for all your efforts.
I have a small problem with the second chart, your investment categories – the chart isn’t showing, and a error message is there : “Couumn 2 must be numeric”
Any help please most welcome.
Hi Carl,
Thanks for the kind words! Sorry to hear that you’re having issues.
Can you share your spreadsheet with me by email (see the bottom of the post) so that I can take a look and troubleshoot?
Thanks for your reply, I actually worked it out myself, just needed to copy a few cells around that were missing on my side- so all good now.Works really well.
Have you thought of creating a total wealth sheet, which would link the investment sheet, with information on bank accounts (manual input – not linked to the actually banks, maybe linked to the budget sheet you have made? ) c other investments, cards etc, for a one sheet overview of were ones money is, as a high over view.?
Once again thanks for all your efforts on these sheets, they have inspired me very much.
Carl
Thanks Carl.
I’ve built a simple sheet to track my net worth over time here: https://themeasureofaplan.com/getting-your-ducks-in-a-row/
At the end of each month, I spend a few minutes to log in to each of my accounts and manually input the current balance. This sheet then provides a history of my overall net worth by month (total assets, debt, implied net worth).
In the future I may try to build something more sophisticated that auto-links to some of the other tools I’ve built, but I think my system works fine for now, and I don’t want to over-complicate things for users.
This is awesome; thank you! Anyway you can add a calculation to calculate dividend revenue by month and year? I would like to track dividend progress. Thank you!
Thanks Div Interest.
I’ll try to add that in for the next version, to be published hopefully this month.
Hey Div Interest,
I just released version 5.0 of the investment portfolio tracker. On the “Dashboard” tab, you’ll now find a section which tracks your dividends received over time.
There is a report on dividends received over the past 5 calendar years, and also for your monthly progress over the past 24 months.
Thank you again for adding the dividend tracker. This is a really awesome tracker. A couple more requests if I may:
1) Investment Categories: Anyway to make this 20? Or add a new version. I like to track performance through sectors and there are at least 10 of them. Add to that, I like to track index funds separately so 10 is not enough. So perhaps a Sector section?
2) I don’t think the Investment Returns calculation is how I would normally track my returns. It calculates all my sells as withdrawals which somehow distorts my return value. While I rarely sell, I do so sometimes and I re-invest my money always. I found that unless I use Reinvested Capital instead of Buy, it distorts the return value. However, I do not like using that because my sold money mixes up with my contributions and therefore hard to track. How about make an assumption that all new contributions are from sales until the contribution amount exceeds the sell amount and then the assumption can be any money over that is net new money to the account?
Again, this is by far the best tracker I could find.
1) I’ll test out adding some more investment categories. The spreadsheet is a bit slow as it is, so I don’t want to add too much more weight.
2) The spreadsheet treats all buys as contributions, and all sells as withdrawals. If you reinvest the proceeds from a sell, this will have no impact on your performance figures. See this simple example that I created: https://docs.google.com/spreadsheets/d/1kl0Zws1mRvu1K14z4qWjxz7HcFhwfiOobS59gPuBwJ8/edit#gid=0
You’ll see two examples. The first example treats the sell as a withdrawal and the reinvestment of the proceeds as a contribution. This is how the tool works today.
The second example ignores the withdrawal and contribution. The money-weighted return calculation is exactly the same between these two methods.
When you calculate your own returns, are you calculating the money-weighted return?
Took me a while to get around to this. I am referring to Investment Returns calculation. I calculate it the following: net sales proceeds + dividends + unrealized gains. I calculated the net sales manually and added dividends and unrealized gains from your spreadsheet and my numbers are ~58% higher.
I calculated sales by taking average of all sales from average of all buys (even if I did not sell everything). Your calculation looks like it does not take into account dividends because when adding sales + unrealized gains, it was pretty close or simply a coincidence.
Hmm, that’s strange that we are getting such different numbers.
I’m using a money-weighted methodology to calculate those returns (https://www.investopedia.com/terms/m/money-weighted-return.asp). The calculation used already takes dividends into account as well.
What time period are you using to calculate your return? The tool will give you an annualized return if the period is longer than one year, and a simple year-to-date return otherwise.
I am only referring to “Investment Returns” calculation (cell F76 in “Dashboard” tab) and not the time weighted return. When I look at the calculation (cell B1581 in “Calculations” tab), it only counts Buys and not Dividends or am I wrong?
Thanks for always being responsive.
Which version of the tool are you using? In December, I changed the return calc to include dividends. That was version 3 — the latest is now version 5.2.
Also, FYI there is no time-weighted return in the tool. Only money-weighted. When I say that the return is annualized, it means that return periods longer than one year will be converted back to an annual rate.
For example, if you had a return of 12% over 19 months, the tool will actually show you an annualized return of 7.4% instead (1.12)^(12/19)-1.
I am using 5.0. I don’t think the version is an issue. I also do not care about time weighted return. I am referring to “Investment Returns” which gives me my total return over the life of the investment. The calculation does not include dividends IMHO in cell B1581.
I took a look at v5.2 and the cell I am referring to there is B1596 (Contributions). Your calculation for Investment Return is this: Portfolio Ending – (Portfolio Starting + Contribution – Withdrawals)
The issue is none of the variables in this calculation are accounting for dividends unless I am missing something?
1) Portfolio Ending is value of stocks held at end of trading day
2) Portfolio starting is value of stocks held at end of day
3) Contributions is stocks bought
4) Withdrawals is sales
Where is dividend calculated? You would either need to add it to Contributions or add it as a separate variable. I would prefer it as a separate variable.
Thanks.
Hi Div Interest,
I think I understand now. The Investment Returns cell on the Dashboard (cell F76 in v5.2) and the money-weighted return calculation (cell G78) are two different things.
The investment returns cell shows the implied returns to reconcile the starting portfolio balance to the ending portfolio balance. Investment returns = ending – starting – contributions + withdrawals
This spreadsheet tracks your investment portfolio (i.e., the investments that you currently hold), as opposed to tracking your total cash balance. So if you receive dividends which are not re-invested back into the portfolio, that cash is no longer in your portfolio. Thus, it is not in the ending portfolio value, and therefore also doesn’t appear in the investment returns amount. I cannot add a column for dividends without throwing these figures off-balance.
i.e., if you hold $50K of stocks and $3K of cash, this spreadsheet only tracks the $50K (as opposed to $53K).
However, for the purposes of the money-weighted return (cell G78), dividends ARE included in the return calculation. If you want to see the full backup where they are included, see the tab “Calculations”, in the section Money-Weighted Return, starting on row 282.
In columns C and D, you’ll see that dividends are included. Thus, if you had a price return of 8% per year, and a dividend yield of 2% per year, your money-weighted return will be 10%. This 10% figure will then be reported on the dashboard in cell G78.
This money-weighted return is the relevant figure to look at when considering your portfolio performance.
This is a very useul spreadsheet. Thank you. I have one (noob) query. How do I enter bonus shares? The Transactions drop-down list doesn’t have that option.
Thanks Chidra.
By bonus shares, do you mean a “stock dividend” transaction where the company issues new shares to each of its existing shareholders?
If so, you can just add a new “buy” transaction on the trade log where you buy the number of new shares you’ve received for a price of $0 per share. The net effect will be to increase your share count without impacting your adjusted cost base for that investment.
I hadn’t heard the term “stock dividend” before, but yes, it’s when a company issues new shares to existing shareholders free.Thanks for your prompt answer. That should solve my problem.
For some reason some of the information I have entered into the Trade Log does not appear in my Portfolio Holdings.
Specifically I have enter 30 shares of AAPL at 170.52. It show Quantity of Units as 30 but shows -0- Cost Base in Portfolio Holdings.
I have tried to copy and paste the formula and also deleted and re-entered the transaction but have not had any success.
Any suggestions?
Thx
Hi Kim,
A couple ideas:
– Is cell C2 of the dashboard set to a date that’s after the date you bought those shares?
– Can you try opening up a fresh version of the spreadsheet, then pasting in your data from the “Setup” and “Trade Log” trade logs tabs into the new version? Doing this type of refresh can often fix things if you accidentally changed or deleted some formulas
If it still doesn’t work, can you share your spreadsheet with me by email? I can take a look and troubleshoot.
Thanks for the quick reply. Dated is set for after. I will try a fresh install as suggested and see how that works. Thx
I have just spent the last several weeks with version 4.4 of the spreadsheet and it is absolutely fantastic! Thank you, I love it.
I found a bug in the Trade Log: Cell L2 uses the Setup Sheet, but only goes to column $C$86, when there are 100 more rows in the Setup, so it should go to $C$186. Likewise in the same formula for B86 (should go to B186.
Question: Is it okay in the Trade Log sheet to enter rows non-date order? That is, do the dates need to be ascending or descending order for everything to work properly?
Question: Contributions and withdrawals don’t look right to me on the Dashboard. The source cells on the calculations sheet only has two rows of meaningful data under “# of cash flows in period”. How does the spreadsheet indentify or define Contributions and Withdrawals?
Now, I have a few feature requests, and I am hoping these will be easy to do:
1) I added 1000 rows to the trade log because I had more than 1000 buys/sells/splits. At first, this broke a bunch of stuff but I am spreadsheet savvy so I was able to fix everything. Now I realize that as you release new versions I will have to make the same changes I already made again and again. So my request is for you to add 1000 rows to the Trade Log
2) My portfolio is complex. Could you add these items to the Setup tab:
– another 100 rows to Holdings?
– another 5 rows to Accounts?
– another 10 rows to Investment Categories?
3) I invest through several different investment strategies, and I like to track how these are doing, so I used the Investment Categories to manage this breakout. Works awesome. And this drives me to (yet another) request: On the dashboard tab/Performance Area, would it be possible to add a drop down input box allowing to see performance by Investment Categories?
4) Finally, I purchase Options and google finance does not seem to be able to pull prices for options. Would love to add ability to track options as a over the top feature request.
Thanks again for a really useful tool for tracking investments!
Hi Gary,
Thanks for your comment. You’ve clearly done a detailed scrub-through of the tracker, and I’m glad to hear that you find it useful.
– Good catch on the formula on the “trade log” tab which was only picking up 50 stocks instead of the full list of 150. This is now fixed
– You don’t need to enter your trades in sorted date format. The formulas can deal with any random date order. My own version of the spreadsheet (which is not the most organized) can attest to that…
– On the “Dashboard” tab in the Performance section, you can select the start and end dates for which you’d like to analyse your portfolio performance. The spreadsheet calculates the market value of your portfolio on those start and end dates. Then, the “contributions” are simply the sum of the value of all your “buy” transactions from the Trade Log IN BETWEEN the two selected dates, and the “withdrawals” are the sum of the all your “sell” transactions on the Trade Log (again between the selected dates). The “Investment returns” figure is then implied based on a formula: investment returns = ending portfolio value – contributions + withdrawals – starting portfolio value. These figures are then used to calculate your portfolio money-weighted return (using an IRR formula)
– In the new version 5.0 of the tool, I added a table in the Performance section on the Dashboard which breaks down your overall portfolio return into a return by each investment category. I believe this will address your ask #3?
For your feature requests, I will mull them over a bit further. As the spreadsheet already runs fairly slowly, I’m a bit hesitant to add too much more weight (more than 150 stock tickers, more investment accounts / categories, etc.).
When I have some time, I’ll do some testing to see what I can add without adding too much more run / update time.
Re: options, I don’t know of a way to auto-pull market values for these, but if I come across something I’ll try to add it in.
Thanks again for your comment.
I just upgraded to version 5 and I see that my feature request #3 above is essentially fulfilled. Shazam! Thanks!
Cheers
I left a response to your other questions & requests yesterday as well. See above.
Hi Gary,
I just wanted to follow up on a couple of your points…
I had some spare time (plus motivation / coffee) today, and managed to make some changes to the investment portfolio tracking tool.
Version 5.2 (just uploaded!) now allows the user to input 2000 transactions on the trade log (up from 1000), and for your portfolio to be grouped into 25 investment categories (up from 10).
I tweaked a few of the formulas as well to speed up the calculation time, which mostly offset the extra bulk added by the increase in transactions / categories.
I’ve yet to add in more portfolio holdings / investment accounts, but hope to get to that soon-ish.
Cheers — hope this helps.
How do I globally change the currency throughout the spreadsheet? I would like to change $ to ₹ (code: INR) without breaking anything.
Hi Chidra,
Unfortunately I don’t know of an easy way to do this in Google Sheets. If you want, you can manually change the $ symbol wherever you see it in the spreadsheet. See this tutorial: https://infoinspired.com/google-docs/how-to-get-your-own-countrys-currency-format-in-google-doc-spreadsheet/
Thank you. I’ll look at that.
This is a brilliant way to track your investments, really great work on the Google Sheet!
I’ve built an Excel Add-In (https://www.excelpricefeed.com) which feeds live financial data to cells via simple formulas. I currently have data from Yahoo Finance and IG Index, I am working on other data providers.
For example to populate a cell with the latest Apple stock price simply use: =EPF.Yahoo.Price(“AAPL”).
I’ve used it to build a much simpler portfolio in Excel: https://www.excelpricefeed.com/tutorials/excel-realtime-stock-fund-portfolio
which retrieves price data from Yahoo Finance and has some simple currency conversions, valuations etc using live data.
I will see how I can implement some of your ideas in conjunction with my Add-in so I can use Excel rather than Google Sheets.
Thanks again for doing this.
Thank you. Noticed the the monthly dividend tracker in Dashboard does not show February…it duplicates March instead.
Hey Interested,
Thank you for pointing that out. I realize the formula I used to generate the dates would cause duplication once it got to be the last day or two of the month. This has now been fixed — see the latest version 5.1 of the spreadsheet.
Cheers.
I’ve been using this sheet since Version 1, and just upgraded to v5.2. Thanks for creating this, so useful!
If you ever find time in the future, it would great to be able to be able to filter asset allocation (‘Your Investment Categories’) by Investment account, to see performance by individual accounts and not just the total portfolio.
Cheers.
Thanks Mike! Having a filter for investment accounts is a great idea — I hadn’t thought of that before.
If I manage to build that, I think I will move to v6.0
Hello, My apologies for what may be the most obvious questions.
1. When I plug in a trade, for example AAPL, the market value under My Holdings is inaccurate and doesn’t update by refreshing the browser. For example, AAPL is listed at $191.24 (currently $200.03). Am I missing a switch that makes the spreadsheet activate?
2. ALB is successfully added to Portfolio Holdings, but when I add a purchase in Trade Log does not calculate into My Holdings (Quantity of Units remains at 0).
3. Am I correct about dividends that if the dividend was received as cash it should be entered once in Trade Log as a dividend (1 unit x $ per unit), and if dripped entered a second time as a buy?
Many thanks! Having no expertise in spreadsheets, and not much in finance, I’ve been looking for a tool like this for a long time. I really appreciate your kindness in making it available and helping resolve issues like mine!
Hi John,
1. At the top of the dashboard tab, there’s a cell that lets you plug in a date. The rest of the spreadsheet will show your portfolio info as that date. If you try entering in today’s date, you should see the same market value per share that Google Finance would show online.
2. Perhaps this is the same issue as in #1. If the spreadsheet is showing your portfolio at March 31st, but your buy of ALB was done in April, the sheet will show 0 units held. Again, changing to today’s date should solve this.
3. Correct about the dividends. You enter a dividend transaction to record the cash received, and then a separate buy transaction if the dividend was reinvested.
Hope this helps!
If other things in the spreadsheet look wonky to you, feel free to share your spreadsheet with me by email. I’d be happy to take a look and troubleshoot.
It does indeed, thank you! Sometimes the most obvious things are the least self-evident. That takes care of 1 and 2, and I’ll get to work now testing the dividends. Thanks again!
Cheers! Glad to hear it works. Best of luck with your portfolio tracking efforts.
Does not recognize stocks from the Philippine Stock Exchange Index (PSEI) and the stocks in it. what seems to be the problem?
I tried to enter stocks from the Philippine Stock Exchange Index. FGEN, FPH, and MER were valid but not the ones I am holding. Other were not valid symbol on Google Finance. I tried to enter PSE:MER but no result. Please could you help me on this?… Thanks in advance.
Hi Feliciano,
Please try going on the google finance website (https://www.google.com/finance), typing the name of the name of the company in the search bar, and copying the ticker that Google Finance shows you (the full ticker including the exchange). Then, use that full ticker symbol in the investment portfolio tracker (Setup tab). Make sure that you delete any spaces in the ticker name.
Unfortunately, google sheets sometimes isn’t able to play nice with google finance and grab the market value. This seems to be more an issue for Asian stock exchanges.
If that still doesn’t work, the only other solution would be to manually input the market value per share on the “Your Portfolio Holdings” tab.
Hello,
Just came across your spreadsheet and must say it’s fantastic! I’m wondering if you could suggest how I would enter holdings that I don’t have the full history. For example I would like to include my 401k holdings but since I’ve had it for many years how would I enter this data in the Trade Log as I don’t even have all the records to indicate purchase date, $ per unit, and # of units. I’m planning to be more diligent with future transactions and would update the trade log with new activity, but just not sure how the enter the “starting” data.
Russ, I’ve been wondering the same thing as I’m coming to this rather late in the game.
A related question, at the other end of the process, is what to do with positions I’ve moved out of. Right now I’ve moved them to the end of Portfolio Holdings on the Setup tab, since to remove them from there deletes them from the larger record.
That helps by also moving them to the end of the list in My Portfolio Holdings. But over time the entry section in Setup is going to fill up (max 150). I wonder if a space for retired holdings might do the trick, or is there a workaround I’m missing?
Thanks for your help, and thanks again for this fantastic tool!
Hi John,
See my reply to Russ about how you can start using this tool even if you don’t have a full history of your previous trades.
In terms of “retired holdings”, unfortunately there isn’t any perfect workaround. The method that you’re currently using is a good one (moving those stocks to the end of the setup tab).
I may try to add more than 150 stocks tickers in the future, but the spreadsheet already runs a bit slow, so I don’t want to add much more bloat.
If you do exceed the 150 stock limit, I suppose you could start recording your trades in a new version of the tool. For example, you could start up a fresh version every decade?
Hi Russ,
I’d suggest just making one lump sum “buy” transaction as of today. Your 401K statement should tell you your total # of shares owned as of today.
Let’s say you’ve got 200 shares of XYZ that you’ve been building up over the past 10 years. If you don’t have the detailed record to indicate all the various times you’ve invested in XYZ, you could just input a single buy transaction on the trade log.
Purchase date: today
# of units: the total number of shares you own
$ per unit: If your 401K statement reports your total cost base, you could divide that cost base figure by the # of shares to get your blended average $ per share. If not, make your best guess
I hope this helps!
Thank you so much for the reply. I do see a value called Cost Basis on my statement so your suggest was perfect! i appreciate your time and for sharing such a great spreadsheet.
You’re welcome! Glad to hear that it works.
Hi John,
Thanks for the great amount of work you put into this tool.
Quick question from a not so advanced investor : my understanding is that dividends are part of the performance of a portfolio in terms of value ($).
However, in the ‘total value of portfolio’ chart, dividends don’t seem to appear. I consider cash dividends as withdrawals (just as cash dividends goes to a cash account with my broker and is usable). In your file, I have to sum dividends (max 5 years) with investment returns (max 5 years again) to get an accurate view of the actual cash I would have if selling all.
I understand that annualized return / money weighted performance includes dividends. However, I’m not so familiar with this metric and not sure how to use it with regards to my dividends question.
Could you share your view and understanding on this ? Perhaps I’m missing something that is obvious to a more seasoned investor.
Thanks a lot,
Tim
Hi Tim,
This tool is meant to track the value of the investments in your portfolio. However, it does not track the cash that’s currently held in your portfolio.
If you receive a dividend and do not re-invest that dividend into new investments, that cash will no longer be a part of the total value of your investment portfolio, as reported in this tool.
However, if you wanted to get an estimate of your total portfolio including cash, you can sum up the total portfolio value + your total dividends received. You can see these values on the “Your Portfolio Holdings” tab, in cells U157 and Y157.
On the “Dashboard” tab, the calculation of the money-weighted return includes both price return (i.e., stock price increases), and dividend returns (cash flow you received). So if the price of your stocks increased by 8% this year, and you received a 2% dividend yield, this calculation will report your total return of 10%.
For more reading on the money-weighted return, see here: https://www.investopedia.com/terms/m/money-weighted-return.asp
Also, FYI — my name is not John!
Hi,
Sorry about the name mistake and thanks very much for your quick feedback !
I understand better the difference you make between portfolio value and cash flow.
Do you have plans for cash integration in your tool ? If not, I will try and add my own computations.
Again, thank you for the hard work.
Tim
For now, I don’t have plans to add cash tracking into this tool.
It would put added burden on the user to track when they deposit cash into their brokerage account, and whenever they withdraw money from the account.
However, if you do want to track your cash balance as well, you can try this workaround:
– On the “Setup” tab, add a new stock ticker called $CASH (or something else that doesn’t return a market value on google finance)
– Whenever you get extra cash in your account — dividends, contribution, etc., enter in a buy transaction on the Trade Log where you purchase X shares of cash at $1 per share (X being the total amount of added cash)
– Then, on the Your Portfolio Holdings tab, in the manual price entry column, input a value of $1 per share for your $CASH investment
– Now, you’ll see your new ticker $CASH, and the corresponding total $ amount reflected
– If you use up that cash, remember that you’ll have to enter a corresponding sell transaction
That’s an interesting workaround !
thanks a lot and have a great day.
Hi,
First off, thanks so much for this! My broker doesn’t give me a performance report, so this is super helpful.
I just have one quick question – I could not find any part relating to realized gains/losses? If I sell all of my position, is there a way to see just the gain/loss for that particular stock? Or a summary that breaks down all the realized gains/losses on all sold stocks?
That would be super helpful as I’d like to know how my individual trades did.
Thanks again, Brendan.
Hi Brendan,
Good question…
A feature that reports realized gains / losses doesn’t currently exist within this tool. As it stands, the tracker only reports upon investments that are held within your current portfolio.
I’ll try to build this in the next time I release an upgrade to the tool.
Cheers.
Thanks! Look forward to the next iteration of the tool.
In the meantime, do you know if its possible to quickly get the realized gains from the spreadsheet as it currently is?
Brendan
You can try this:
– On the dashboard, set the date to be one day before you sold your position
– Go to the “Your Portfolio Holdings” tab, and take note of the cost base per share of the holding
– Then, you can calculate the realized gain per share as the price you sold the investment at, minus the cost base per share
– Multiply that realized gain per share by the number of shares you sold, and that will be your total realized gain
For example, if your cost base per share was $10, and you sold your position for $15 per share, your realized gain would be $5 per share. If you owned 30 shares, this would be a total realized gain of $150.
I have had this issue with a few earlier versions of your Tool and have updated a few times thinking that the problem would be corrected. Currently using version 5.2. The issue is that some of my holdings do not show the initial Cost Basis (Stock Price) when purchased. The number of shares are correct, the current stock price is correct from Google, and the overall market value is correct but it does not show a purchase price so it skews the overall returns as a result. It looks as though I did not pay anything for the shares I own. The date on the Dashboard is always current, the transaction is entered correctly in the Trade Log and I have tried refreshing and as I said upgrading to newer versions but the issue still exists. It is not always the same security where this issue occurs when I upgrade to the latest versions of the Tool. Any thoughts or suggestions? Other than that the Tool is amazing!!!
Hi KB,
The cost base info should show up assuming the following:
– A “buy” transaction has been entered on the trade log, including a date (in mm-dd-yyyy format), and a total $ amount
– You have not sold that position yet
– The date on the dashboard is set to a value that is after the date you purchased the shares (again, in mm-dd-yyyy format)
Could you share your spreadsheet with me via email? See the bottom of the post for my email address. I can take a look and troubleshoot.
Today I upgraded from ver 3 to 5.2 – awesome job on all the new features!
I was wondering if you have plans for including further breakdown on the performance tab for individual stocks. Initially it was the full portfolio, now it has separation by Investment category and a logical step might be to go to an individual stock. This way you can compare how your stock are performing compared to one another for a specific time frame.
I also saw in the comments ask for a realized gains/losses and although I don’t plan to sell any stocks for the next decade or so – at some point in time this certainly looks useful.
Thank you so much for continuing to develop the spreadsheet. For me this is so much better than brokerage provided reports that I have seen.
Thanks Free Space. Happy to hear that you’ve been getting good use out of the spreadsheet.
For the performance of each of the stocks in your portfolio, you can flip to the Your Portfolio Holdings tab. This will show your unrealized gain for each stock, and the dividends received for each stock.
Starting on columns AC, you can also see the starting and ending price for each stock for the time frame you’ve selected.
When I release a new version, I should probably add a column which shows the % return over that time frame (ending price divided by starting price, minus 1).
You are correct – I’ve never scrolled past column Y. So yes, perhaps a column for % will be a good addition. Thank you!
Hi there. First of all, thank you very much for sharing your work. It’s incredible useful ^^
I’m just wondering if it can be possible to create, on the dashboard space, a sort of motion graph in which is shown the portfolio performance over time compared to an Index, let’s say an MSCI ACWI.
Thank you very much
Hi Giamma,
Very good idea! I’ve had a similar thought in the past, but have never gotten around to tackling it.
It would be fairly complicated to implement, as I think I’d need to write a script to grab the portfolio value at various points in time, adjust the values to assume that all dividends are re-invested, and then compare that against a chosen index (again, on a dividend adjusted basis).
I will keep it in mind for future versions of the spreadsheet.
Cheers.
Can you comment on the process for a reverse stock split? I see that a 2 for 1 stock would result in 2 additional shares for every share owned when the number 2 is entered in Column J. So would you enter .33 for a 1 for 3 reverse split? I have selected Split and the Symbol and placed .33 in Column J but my shares are still unadjusted in Portfolio Holdings (Those are the only entries made for this split. I started with 1,008 shares and after the reverse split should have 336, but Holdings are still showing 1,008). Am I missing something? Dates are all correct. Thank you.
KB
Hi KB,
I did some troubleshooting on this. I had made a typo in one of the formulas for the stock splits. I’ve fixed the formula and have uploaded a new version 5.3.
Please try it out, you should be able to enter in stock splits now.
As a hypothetical example to show how the splits work:
– I buy 300 shares of AAPL on 01-01-2018 — enter a BUY transaction on the trade log with this info
– On 06-30-2018, AAPL splits using a ratio of 0.33 (you receive 1 share for each 3 shares that you previously held) — enter a SPLIT transaction which specifies the date of the split, stock ticker, and split ratio of 0.33
Now if you set the date cell on the Dashboard tab to any date after 06-30-2018, you’ll see on the Your Portfolio Holdings tab that you now hold 100 shares of AAPL (300 shares that you bought originally multiplied by the split ratio of 0.33). All of the cost base info will be adjusted accordingly as well.
Thank you, working great now. Apologies for the late reply I have been out of town. Thanks again.
Cheers, you’re welcome!
Hi,
Thanks for creating this spreadsheet, really appreciated it! Just had a quick question regarding “all in one” ETFs. There are ETFs that contain 30% domestic equity, 40% international, and the rest in fixed income. I was wondering how that could be reflected in the ‘setup’ portion of your tab since we are only allowed one option.
Thanks,
Hi S,
Great point about all in one ETFs. Unfortunately, there isn’t a great way to categorize these funds in the portfolio tracker. On the Setup tab, you could create a new category to tag these as “Blended” or “All in one” or “Mixed” investments. This would distinguish them against pure equity or fixed income investments.
While the rest of the spreadsheet will function OK for these ETFs, the re-balancing calculations won’t take these all in one investments (and their respective equity / fixed income weightings) into consideration. As it is, those re-balancing calculations would need to be done manually.
In a future version of this spreadsheet, I’ll try to think of a way to allow the user to specify the category weightings within these all in one investments.
I’m pretty sure the Dividend Reinvestment method of logging a Dividend transaction then logging a Buy transaction is double counting my portfolio value on the Dashboard. If I compare my spreadsheet to my Questrade account the spreadsheet is high by almost exactly the amount that I have logged as Dividend Reinvestments. I’m pretty sure it’s counting the Dividends as cash in my account and a Buy as if I had transferred in that same amount again.
Nope, after triple checking I’m absolutely wrong and just can’t read properly. My bad!
Thanks Dan — no worries!
For others who may come across this, please see the Frequently Asked Question #1 in the post above for the specific steps you can take to record dividends in this spreadsheet, whether they are re-invested or not.
I got going with this about a month ago. It’s so intelligently laid out and I have crawled through various parts when I was troubleshooting something that didn’t work. In every case except one, it was just a mistake on my part, i.e. copying and pasting a line which did not bring over the functions in cells, etc. So, I was happy enough with it, and with your website in general that I gladly donated, too!. I appreciate the value you provide to a fairly new DIY investor like myself.
But, a couple of days when routeinly adding a new symbol in the Setup worksheet, it came up with ‘#N/A’. I checked and double-checked but no dice. CSE:INDS was not returned from Google Finance. Note that this company just listed in April, 2019, so it is fairly new. I went to the google page and searched for it manually. As I was afraid of, it simply does not exist in their database. That brought my TMOAP Portfolio Tracker to a screaming halt.
Although I think I know what the answer will be, is there any kind of workaround for this problem? From what I see, Google Finance just hasn’t bothered to add it, and probably won’t.
I haven’t tested my theory by checking any other new listings to see if it is a global problem,i.e. they stopped updating their database.
Any information/feedback would be much appreciated!
thanks
Hi Jim,
First off — thank you for your generous donation. It is much appreciated!
For your question about the missing stock ticker for Indus Holdings, I was doing some searching around on google finance and came across this ticker in their database:
OTCMKTS:INDXF
You could try this one out. It seems to be the same company Indus Holdings, but I’m not 100% sure.
If that doesn’t work, the only option would be to enter in the price manually for this stock. See the Troubleshooting Tips section of this article, and the frequently asked question #2.
Lastly, I have my fingers crossed that Google Finance will update their database to add newly listed holdings such as Indus. As you mention, the stock is quite new, so perhaps Google will include it soon!
Hi,
My apologies for not just going with the FAQ answer to my question. I should have mentioned that I did see the OTCMKTS:INDXF ticker but was hoping to find a dynamic way of keeping everything in CAD$ (like the CSE ticker), but entering it manually will do fine. I may not have this stock much longer anyway, but for now will hope that Google will get it added. The fact that it skews my CAD$ and USD$ totals a bit is not a big thing in my situation.
The good news is I checked on a random half-dozen tickers that listed in the last couple of months, just to test, and they all were found in Google. So, I am glad that it does not seem to be a trend. Just my luck, haha.
Your tracker works really well, and I am happy to have come across it and your site. Thanks so much for your response. You go above and beyond, as I can see with all the comments here.
Thanks Jim, and no problem at all for asking the question!
Best wishes to you and your portfolio
do you have the spreadsheet in Excel format?
Unfortunately not!
This spreadsheet automatically grabs current AND historical stock prices from Google Finance. Google Sheets has this integration, but excel does not.
As such, this tool remains only as a google sheet version for now.
How do we ( if we can today ) add venture stocks to google sheeets, I have tried TSE:, CNX:, V:, TSXV:, no go.
Hi Doug,
Please see the Frequently Asked Questions section of this article, question #2.
I did some searching on Google Finance, and found the ticker CVE:CNX for Callinex Mines.
This ticker seems to work.
For the most part, if you’re able to find the stock ticker on the google finance site, you should be able to input it into this spreadsheet.
Thanks for the quick, works just fine. did read the Frequently Asked Questions , just did not sink in. ty
Cheers, glad to hear that it’s all working!
What is the best way to track money in and out and liquidity? What I did is to create holdings called Cash CAD and Cash USD in each account. So when I sell a stock I buy Cash in the same currency of the stock and when I buy a new stock with the cash, I sell the Cash as a transaction. It seems the calculations doesnt work so well so far.
Hi Eric,
As you’ve seen, the tool does not automatically allow for the tracking of cash in your investment account.
However, if you do want to track your cash balance as well, you can try this workaround:
– On the “Setup” tab, add a new stock ticker called $CASH (or something else that doesn’t work return a market value on google finance)
– Whenever you get extra cash in your account — dividends, contribution, etc., enter in a buy transaction on the Trade Log where you purchase X shares of cash at $1 per share (X being the total amount of added cash)
– Then, on the Your Portfolio Holdings tab, in the manual price entry column, input a value of $1 per share for your $CASH investment
– Now, you’ll see your new ticker $CASH, and the corresponding total $ amount reflected
– If you use up that cash, remember that you’ll have to enter a corresponding sell transaction
From what you’ve written, it sounds like you have tried something similar. The calculations should work as long as you enter the appropriate BUY and SELL transactions to reflect cash coming in and going out. You’d also need to record an initial BUY transaction when you first contribute the cash into your investment account.
Many thanks, pretty much what I’ve figured. Calculations seems off but I will take the time to re-enter the transactions in a orderly manner… and get back if still have issues.
That sheet is simply a Great work!
Cheers!
Cheers, thanks Eric.
Hello & thanks very much for your spreadsheet. I have a question. In the Settings Tab I have added more Investment Accounts. However in the Trade Log sheet, Column I, the drop down menu only shows 6 Accounts. Is there a way to show more than 6 accounts. Or do I have to set up additional copies of your Google sheet to track additional accounts. For example 2 sheets to show 12 accounts.
Hi Nick,
Are you using the latest version of the spreadsheet — version 5.4? You should be able to add a max of 10 investment account options.
Once you fill-in the 10 account names on the Setup tab in cells B39 to B48, the trade log tab column I should let you select from those 10 accounts.
I just tried it out in my own version and it works fine.
Can you try re-opening a fresh version of the spreadsheet, re-pasting your data from the Setup / Trade Log tabs, to see if it fixes the issue?
If you’re still having trouble, feel free to share your spreadsheet with me by email (see the bottom of the post for my email address), and I can take a look and troubleshoot.
Thanks very much for your quick response. I noticed my error was in trying to copy and paste additional lines to create more investment accounts. This looks like it works in the the setup tab but unfortunately not in the trade log. I see from reading all the comments that you don’t want to add more to slow down the tracker. Fair enough an easy workaround if you have more than 10 accounts is to set up another sheet.
Two other questions.
If I receive interest income in an account or dividends I notice that the amount is rounded to the next whole dollar #. For example entering $4.65 in the trade log shows up as $5 in the Portfolio Holdings whether the transaction type is a Buy/Dividend option. Is this done on purpose to simplify things?.
Also, should I enter all cash dividends received from any ETF/stock in the trade log as a BUY transaction type and not as a dividend option using a stock symbol from any company as for example $CASH. I find if I don’t do it this way the increased $ amount of my cash holdings does not increase to reflect things properly. For example $10,000 in cash + $5.65 dividend will only show up as $10,000 in Porfolio holdings tab column K & L, while the dividend will show up as $6 in column Y.
In eccense I believe you can’t properly track cash & dividends at the same time even if the amounts are inputted manually.
I am using the latest version. I found your website 2 days ago and thanks so much for sharing it!!
Thanks so much
Hi Nick,
On the “Your Portfolio Holdings” tab, there isn’t any rounding being applied. The sheet is just not showing the decimals for the purposes of visual simplicity. If you want to see the full decimals, you can change the format by following these steps:
https://www.solveyourtech.com/increase-number-displayed-decimal-places-google-sheets/
For your question about dividends, see the Frequently Asked Questions section of this page — question #1.
If you want to track your cash balance as well, you can do so using the $CASH method. When you get a dividend, you’d then be entering two transactions (1 DIVIDEND transaction for the stock which paid the dividend, and 1 BUY transaction for your custom $CASH ticker).
Hey! Amazing work on this, Also thanks for sharing!
I have a feature request though (I would add it myself but then it won’t be there for future versions).
In certain markets the prices are quoted in cents. For example TLV market quotes are in ILS cents, so a 25 ILS stock shows as 2500 in Google Finance.
This can cause issues in two ways:
1. If you enter non-cent values into the transaction log, all the return values will be in the thousands of percent.
2. If you enter the cent value into the transaction log, all the ratios of how much this stock is of the account will be off.
My solution would be:
1. In the setup page include another column next to the currencies which will define a market quote factor
Then, either have the transaction log in cents and just divide by the factor when calculatin portfolio shares.
Or, have the transaction log in full units and divide or multiple when comparing to the Google Finance value.
Also, I’m having an issue which maybe you know how to resolve?
The contributions value is wrong. I believe this is because there is an error in the calculations tab on cell D284 with the message: “Circular dependency detected. To resolve with iterative calculation, see File > Spreadsheet Settings.”
When I turn this on the spreadsheet seems to start adding value to the table below which were missing before, but it seems to get stuck in a loop and my computer starts working very hard. Have you ran into this issue?
Additionally, I have couple extra feature requests after adding my transactions for you to consider adding
1. Tax Considerations. I know this is probably a ton of work that’s why it isn’t there yet, but it would be amazing if you could consider tax on dividends and sales. (With a default per account and an option to override tax per transaction).
2. The ability to enter a stock merger/acquisition transaction. Currently you have to enter a few manual transactions to represent this. However, besides being cumbersome this won’t work well if tax support is added since converted shares are not taxed until sold, and the portion which is converted to cash is taxed. (I can’t think of a way to manually enter this decently).
Thanks again for this amazing spreadsheet.
I figured out my issue:
I reordered the transaction log at some point and didn’t notice the collapsed columns on the right so that messed some things up.
Maybe it would be nice to move the collapsed columns to the calculations sheet since sometimes it’s nice to be able to reorder the transactions.
Hi Jason,
Thanks for your feedback. You’ve clearly done a detailed scrub of the spreadsheet!
I will keep your suggestions in mind for future versions of the tool.
Adding tax calculations is something I’ve wanted to do for a while. However, it would be quite complicated given that tax rules are different by country, and given that some investments accounts are tax-free while others are taxable.
Lots to think about!
Thanks for sharing this. I am enjoining your sheet a lot! One Question. Is there any simple way to add one allocation ETFs like VGRO or XGRO, if I can add the fund like VGRO and its allocations (like 20% in fixed 35% Canadian 55% US)?
Hi Won,
Good question about “all in one” ETFs. Unfortunately, there isn’t a great way to categorize these funds in the portfolio tracker. On the Setup tab, you could create a new category to tag these as “Blended” or “All in one” or “Mixed” investments. This would distinguish them against pure equity or fixed income investments.
While the rest of the spreadsheet will function OK for these ETFs, the re-balancing calculations won’t take these all in one investments (and their respective equity / fixed income weightings) into consideration. As it is, those re-balancing calculations would need to be done manually.
In a future version of this spreadsheet, I’ll try to think of a way to allow the user to specify the category weightings within these all in one investments.
Hey, fantastic portfolio tracker. You should be very proud of this, it’s amazing.
One quick question- is there any way to be notified if you update the sheet or fix a bug? Perhaps some way the sheet could display “newer version available” when there’s an update?
Also, I added this chart to the dashboard that I think adds a lot of value- https://drive.google.com/file/d/1pYgbgEcZ0LV8QLcxkCS5curpxpxUZgJs/view?usp=sharing
Thank you!
I just did some digging around but I can’t find a good way to auto-notify people about a change to the sheet. The issue is that each user is making their own personal copy of the spreadsheet, so when I make a change to the master document this doesn’t propagate to the previous copies of the file.
I’m not sure that there’s a way unfortunately, other than just manually checking back on my site every once in a while.
About your new dashboard chart, that’s a great idea! I’ll add that in the next time I make updates to the file.
Update: today I uploaded a new version 5.5 of the spreadsheet, which now includes the chart for performance by investment category.
Hi!
I am wondering if there’s a way to enter a “Non-Resident Tax” other than under Trading Fees. I hold US Bancorp under Canadian account. When a dividend is issued, I get charged a non-resident tax. I want to track the tax separate from commission/trading fee. Just wondering if there’s a work around.
Thank you!
Hi Andrew,
Good question — at this point there isn’t a great way of tracking these non-resident taxes.
One workaround that I would suggest:
– Enter your dividend transaction as per usual (e.g., $10 dividend reflecting the total amount)
– Enter a second dividend transaction, this time with a negative amount showing the non-resident tax (e.g., -$1.50)
Now, you’ll have two entries to reflect the total dividend and the taxes paid.
You can use filtering on the trade log tab to view your overall dividend record.
Hope this helps!
HI!
The re-balancing sheet only shows up to 10 of the categories I created and seems to ignore all other categories. Anything I can do about it?
Many thanks for your advise!
Best wishes,
Bob
Hi Bob,
Good catch! A few months back, I increased the max investment categories from 10 to 25. At that point, I forgot to expand the re-balancing tab accordingly.
I’ve now made the change and have uploaded a new version 5.5.
To ‘upgrade’ to the new version, just open up a fresh copy of the sheet, and paste in the info from your old “setup” and “trade log” tabs into the new version.
Hope this helps.
Hi! Great work, thanks for sharing this awesome spreadsheet!
One quick question, what if I buy a stock in US$, but pay the trading fees in EUR?
I’m still exploring the spreadsheet, but I think that the trading fees are always in the same currency as the ticker. Do you see any way of working around it?
Thanks in advance
Hi Daniel,
Thanks for your question. Unfortunately, the currency needs to be consistent within each row of the trade log. This means that you’ll need to do the manual calculation yourself to convert between US$ and EUR when you input it into the spreadsheet (i.e., convert trading fees to be in the same currency as the stock purchase).
Hi, thanks for sharing this. It’s really helped me track my investments.
I have a question regarding dividends. In the trade log tab, where do I input them?
Thanks.
Hi Joey,
To input dividends, just record them in a separate row on the Trade Log tab.
You’ll need to input the stock ticker, and the total $ amount of the dividend (e.g., receiving $100 in dividends for stock ABC). It’s optional if you want to also record the # of shares / dividend amount on a per share basis.
Hello, this is a very impressive tool for me, thanks a lot.
In the dash board, it can’t show contributions amount. All contributions convert to investment return. Is there anything I have done wrong?
Thanks
opps, I re-input the data to a new sheet and the problem solved.
Sorry to bother you.
Hi yh, glad to hear that you resolved the problem. Starting over in a fresh version of the sheet tends to solve many issues!
Happy new year.
[…] If you are interested I made these calculations and this pie diagram after tweaking this tool from Measure of a plan […]
I have now been using this for around a year and I love it. Thank you! I have a few suggestions if possible:
1. A performance section by currency. Nothing complex, just duplicate rows 75-78 in the Dashboard tab. I have Canadian and US stocks and would like to keep track of their overall performance separately on top of the overall section.
2. Dividend schedule: a new tab that will break down your expected dividends per stock you hold per month over 12 months. I already created a tab for myself but would be great if it would be automated.
3. Add a section to track available cash. Again something I added to mine but if you could add a section to track how much cash someone has and as a % of their portfolio. It would also add value in the rebalancing tab as well.
Thank you,
Repeating this as I did not see my post published. I would like to ask for some additional updates please.
1. Performance by currency so I can track US and Canadian stocks separately. This would just be another section added to the Dashboard tab like rows 75-78.
2. Dividend schedule tab to track expected dividends over next year. I created one for myself but would be great if automated.
3. Add cash on hand item to the portfolio balance as a percentage of all holdings. Also would add value in the rebalancing tab.
Thanks,
Hi Div InvestorA,
Thanks for your suggestions.
1. Good point. I’ll try to add some performance metrics by currency in the next version of the tool.
2. This would definitely be very handy! I’m not exactly sure how I could build this in an automated fashion, but I’ll give it some more thought.
3. For now, I don’t have plans to add cash tracking into this tool.
It would put added burden on the user to track when they deposit cash into their brokerage account, and whenever they withdraw money from the account. This would make it difficult for users to set up the tool with historical trades when they don’t know all of their cash contributions and withdrawals from the past.
However, if you do want to track your cash balance as well, you can try this workaround:
– On the “Setup” tab, add a new stock ticker called $CASH (or something else that doesn’t return a market value on google finance)
– Whenever you get extra cash in your account — dividends, contribution, etc., enter in a buy transaction on the Trade Log where you purchase X shares of cash at $1 per share (X being the total amount of added cash)
– Then, on the Your Portfolio Holdings tab, in the manual price entry column, input a value of $1 per share for your $CASH investment
– Now, you’ll see your new ticker $CASH, and the corresponding total $ amount reflected
– If you use up that cash, remember that you’ll have to enter a corresponding sell transaction
Thank you!
For the cash, I was thinking about something much simpler than that. Instead of every transaction, just total cash by account which you input manually every time. Just to give an idea of 20% of your portfolio is in cash but I understand it’s not critical.
Can you also think about creating a graph to track growth by individual accounts? E.g. yearly growth in value of TFSA, RRSP, personal… and by sector (though less important). I also think one per year for the entire account (most important). I know you have a summary one but you don’t have a yearly one to track trends…like the dividend one but would be better if it would be a line graph on a monthly basis.
Thanks, awesome work as always!
More good points… I will add to the to-do list for future versions. Thanks!
Hi, thanks for making this fantastic portfolio tracker!
There are some suggestions for your consideration. For all the sold-out stock in the “Your Portfolio Holdings”, the unrealized gain was mistakenly shown as the market value, while it should be $0 (I think it is because the the formula uses the market value minus the zero cost base). It would be great if “Realized gain” column can be added to capture the gain of the sold-out stock. Many thanks!
Tony
Thanks Tony, great suggestion. I will try to build this out in the next version of the tool.
Hello,
Thank you for this investment portfolio tracker,
I am having a little issue when comes to dividends, I do not live in the US so my broker automatically converts any dividends I get from my US held stocks from $ to £. So when inputting this information on this portfolio tracker i do not need the currency conversion.
How do i go about removing the currency conversion settings?
Hi Daniel,
The tool currently expects that if a stock is in one currency (e.g., USD), any dividends that you enter for that stock are assumed to be in the same currency.
To make things work in the tool, for your USD stocks you’d need to manually convert your dividends amount and enter them as USD in the tool. For example, if you get a dividend of USD$100 and your broker tells you the amount in EUR (~90 EUR), you’d need to convert back to USD and enter the USD$100 amount into the tool.
Please note that if your stock is a EUR stock (price per share / dividends both in EUR), you don’t need to go through this extra step.
I’m Canadian and I do own some US stocks, but my broker always reports the dividends for US stock in USD, so I don’t have this problem. Unfortunately it seems that not every broker does their reporting in the same way.
As it stands, there isn’t a simple way to toggle the currency conversion settings on and off.
Currently using 5.6, great tool… used it for several years but fell off the train and restarted again. After entering everything several of my securities have $0 cost basis even though the date ranges definitely include buys that did not get sold yet. It’s very strange…
I can confirm that securities that were purchased and not yet sold have correct non-zero cost basis
any security that has had a “Sell” at any point in its history appears to have a $0 cost basis, even if I sold out only a part of the position or sold the position and rebought within the selected time frame.
Hi Jon,
That’s a strange issue that I haven’t encountered before.
Can you look on the Dashboard tab, and check the date that you’ve entered in cell C2? Try entering today’s date and see if this solves the issue.
You could also try downloading a fresh version of the spreadsheet, and re-pasting the info from your old Setup / Trade Log tabs into the new sheet. This often solves issues.
Finally, feel free to share your sheet with me by email (see bottom of the main post). I’d be happy to take a look and troubleshoot.
Hello,
Thanks for sharing your tool, it is fantastic and very useful. Some suggestions which i see some others may have already suggested.
1. Realized PnL after closing out some position (partly and fully)
2. Upcoming Div Tracker
3. Greater Div Analytics to show a) current yield on cost and market price per holding, b) yield by Investment Category, c) yield of total portfolio
Many thanks again!
I second this!
Any ETA on the next update? Thanks!!
Hi utminafrica,
Great suggestions! Hopefully I can implement some of these in a future version of the tool. Hoping that I can make some improvements in the next month or two.
Cheers.
Thanks for looking at this. I would suggest perhaps creating a new tab for a Div Analytics section but either way, this would be very useful.
Thanks again
Cheers
Hi
Amazing work! Congrats!
Anyone knows how to solve the problem of having the “portfolio starting value” at 0$? I added the transactions…but i dont know how to insert an initial portefolio ammount!
Cheers,
Hi Rafael,
I assume that you are looking at the performance section of the “Dashboard” tab. In that section, you’re asked to enter a starting date and ending date.
Try changing your start date to a date that is after you began making ‘buy’ trades in your account. The tool will then show an initial portfolio amount.
Hope this helps.
Hi Jon,
Thanks for the great tool! Is there any way to calculate allocation when you have target date funds like VFFVX?
Thanks,
I second this- would love a way to split out the allocations
Hi Euzel,
Unfortunately, there isn’t a great way to categorize these ‘target date’ or ‘all in one’ funds in the portfolio tracker. On the Setup tab, you could create a new category to tag these as “Blended” or “All in one” or “target date” investments. This would distinguish them against pure equity or fixed income investments.
While the rest of the spreadsheet will function OK for these ETFs, the re-balancing calculations won’t take these all in one investments (and their respective equity / fixed income weightings) into consideration. As it is, those re-balancing calculations would need to be done manually.
In a future version of this spreadsheet, I’ll try to think of a way to allow the user to specify the category weightings within these all in one investments.
I’d love to see this function (target date funds) implemented as well.
I’ve loved the spreadsheet but had a few instances where things stopped working. I just started with a new spreadsheet for those issues and that fixed the problem. Now I have more info entered and would like to solve the current problem I have. On the “dashboard” some of my investment categories are blank for a return. When I go to the “calculations” sheet. Line 1578 has n/a for some of the category calculations. Line 1576 looks accurate and when I review the purchases farther up the spreadsheet, everything looks in order. When I adjust the date for returns to two days earlier everything works. I check the formula in the adjacent cell that works (on line 1578) and the formulas are accurate. Any ideas?
Hi Matt,
I’m not sure that I completely understand your question, but there are a couple of general steps that often fix issues:
– Grabbing a fresh copy of the spreadsheet, and then re-pasting in your data from the Setup / Trade Log tabs. This often solves issues that were caused by broken formulas in your current spreadsheet
– Refreshing the page (this sometimes helps to fix some issues caused by incorrect data being pulled from Google Finance)
Could you try these two steps? If you still have problems, feel free to share your spreadsheet with me via email, and I can take a look and troubleshoot.
Hope this helps!
I’ve tried now with a new spreadsheet copy and refreshing the page. It seems as though the xirr function works for some categories but not for others. It also can work with a different time period entered for some categories. The error message claims it needs both positive and negative values to calculate xirr but that isn’t true (I tried to manually just run the xirr formula for one category). I basically have no idea why it calculates it for some categories but not for others. I don’t see it as any fault of your design, but rather some limitation that is happening with the sheets function. The total return, the aggregate of all the categories is calculated.
I’m guessing that the error actually is because you don’t have a combination of positive and negative values for some categories.
From the google sheets documentation for the XIRR function:
https://support.google.com/docs/answer/3093266?hl=en
“cashflow_amounts must contain at least one negative and one positive cash flow to calculate rate of return.”
This is why the sheet as it’s built considers the initial portfolio amount / subsequent buys as positive values, and any sells / dividends / the final amount as negative values.
Basically, you need both positive and negative values to reflect an upfront investment, and a payoff / profit from the investment.
I’ve noticed the same thing earlier this week.
Upon selecting two different start dates (both before the 1st transaction ever made for the entire portfolio), in one case some of the categories returned n/a but in the other there were no errors.
Seems strange because the values the XIRR function considers are the same since both date proceed the 1st transaction ever recorded in the spreadsheet.
Not sure why
I’d love to see this function implemented as well.
Thank you so much for this tool.
Do you plan to continue releasing new versions?
Hi Miguel,
You are very welcome. I do plan on releasing new versions in the future, but I’ll admit that my progress has been quite slow lately!
Between trying to release new posts / content here, the COVID-19 craziness, and my day job, it’s quite hard to find time to tinker around in this portfolio tracking tool!
Spreadsheet is amazing, about 1000 times better then I can create myself. The limitation of 150 stocks is a slight issue for me as I have 228 – is it possible for me to add some additional entry lines without messing everything up?
Also currency wise, based in the UK, amended the value in the dashboard to GBP but so many entries are in dollars – is it possible for me to adapt the whole spreadsheet to £ as I would only need to amend a dozen to $ instead of the majority to £?
Thanks for taking the time out to share this with everyone, hope your keeping well in the current crazy situation we are all in!
Hi James,
Thanks for your comment.
For your question about currencies, please see the Frequently Asked Question section on this page — question #4.
For the comment about the 150 stock ticker limitation — as the spreadsheet already runs fairly slowly, I’m a bit hesitant to add too much more weight. Also, unfortunately it isn’t a simple change to add more tickers. It would require going through the formulas in several tabs in the spreadsheet and making edits to accommodate for more than 150 tickers.
Hello
Unbelievable Spreadsheet for a newbie like myself. I tried to read through the comments to see if this has been already addressed. Just wondering about classification for “Asset allocation ETFs” e.g VGRO & XGRO on the TSX. They are compromised of CDN/US/International Equity & FI ETFs.
Can you add a feature that takes these investment products into account.
Or should I just weight them as the individual ETF holdings?
Hi Steven,
Thanks for the kind words. For “asset allocation” or “all in one” ETFs, unfortunately, there isn’t a great way to categorize these funds in the portfolio tracker. On the Setup tab, you could create a new category to tag these as “Blended” or “All in one” or “Mixed” investments. This would distinguish them against pure equity or fixed income investments.
While the rest of the spreadsheet will function OK for these ETFs, the re-balancing calculations won’t take these all in one investments (and their respective equity / fixed income weightings) into consideration. As it is, those re-balancing calculations would need to be done manually.
I’m having 2 issues: the cost basis is not reflecting what my broker has listed, and the portfolio holding is only updating for my first two holdings listed in the setup page.
Hi Kyle,
Could you try starting up a fresh copy of the spreadsheet? Download a new copy of the investment portfolio tracker, and re-paste your values from the Setup / Trade Log tabs. This could help if a formula was accidentally deleted in your copy of the spreadsheet.
Also, please try reading through the Frequently Asked Questions section on this page.
If you are still having issues, feel free to share your spreadsheet with me by email, and I can try to troubleshoot.
I use 5-year GIC ladders for fixed income. Can I record these by manually inputting their ‘market value’ and will the tracker include them in total return and asset allocation calculations?
Hi Linda,
For GICs or term deposits: enter a new ticker on the Trade Log tab (e.g., GIC2025, or something else that doesn’t return a stock price from google finance). You can then input your transactions on the Trade Log. For example, you purchase 1 share for $10,000 per share initially, and then later sell the investment for $11,000 per share. Use the manual inputs to reflect the current market value.
These values will then be reflected in all calculations (total portfolio value, returns, asset allocation, etc.).
Thanks so much for sharing this. Took me an afternoon to rebuild 4 years of trading history over multiple accounts in different countries. This is really a great tool.
I have a small issue on the Money-Weighted Return (including dividends). For some reason the xirr function returns n/a in one of the columns of row 1578 in the calculations sheet. I have two investment categories that are unable to calculate the rate of return but can’s figure out why. All the data entry and price readings seem to be correct. Any ideas?
Hi Tom,
Thanks for your comment. I’m not sure what would cause that issue, but a few ideas that you could try:
– Refresh the page (perhaps a couple times)
– Change the ‘end date’ value on the Dashboard tab that is used for the performance calculations. Perhaps try moving the end date backwards or forwards by a few days to see if that helps
– Start up a fresh copy of the investment portfolio tracker, and re-paste your values from the Setup / Trade Log tabs. This could help if a formula was accidentally deleted in your copy of the spreadsheet
I hope this helps.
Thanks so much for your wonderful work. It seems that trading fee can’t be reflected. Is there any fix on that? Thanks a lot and have a good day.
Hi Dewing,
When you enter a value for the trading fee (on the Trade Log tab), this should increase the cost base of your investment. For example, if you are entering a buy transaction on a stock with these parameters:
– Buy 100 shares
– $5 per share
– Trading fee of $7
If it was your first purchase of that stock, your cost base should be $507 (100 x $5 + $7).
I’d recommend that you try changing the trading fee input on one of your buy transactions, and seeing how this impacts the cost base value on the “Your Portfolio Holdings” tab for that same stock. If you increase the trading fee by $100, the cost base should increase accordingly by $100.
No worries! I actually decided to just buy the underlying ETFs instead. Which is better as I can rebalance to the allocation that works best for me. Also so much easier to track with your sheet.
Many Thanks!
Hey thanks for the amazing spreadsheet. Its working for me great on my run of the mill investments, but with the more exotic instruments it does not seem to be transferring things over from the Trade Log over to the Portfolio Holdings. For instance I would like to use the spreadsheet to track my Bitcoin holdings, I understand this instrument is not in Google Finance, but I don’t have a problem putting in the market value manually. Unfortunately it is not showing the Quantity of Units correctly, despite having placed a buy in the trade log. The same is happening with other stocks such as FCX and ASX:FAN. Here is my Trade Log:
https://snipboard.io/OpWiwC.jpg
and this is what my Holding looks like:
https://snipboard.io/dGLaE7.jpg
The only stock its showing correctly is the VTI one. Any ideas what might be happening?
Hi Omar,
Please go to the Dashboard tab and check the date cell (C2). All of the market prices / calculations will be done as of that date. Just edit that date and the rest of the spreadsheet will adjust accordingly.
As long as you set the date to be after your trades on the Trade Log tab, everything should function OK.
I hope this helps.
Thanks mate, this was exactly the issue. Now everything is showing up fine. Cheer!
You’re welcome!
Kudos again for the wonderful spreadsheet! I keep discovering new features and I’m liking it more and more. I had one question though about how the spreadsheet works, If I look at the Dashboard and in the Total Value of your Portfolio section, I’m a bit puzzled how Contributions is calculated. I have deposited a total of $7100 into the account I’m tracking and the spreadsheet is saying I have contributed $8774. Here is a screenshot :
https://snipboard.io/wrnAaK.jpg
I’m guessing the contributions are not calculated just from deposits but also take into account reinvested capital. I’m my case I have indeed sold some securities and reinvested in new securities, so guessing thats where the extra money comes from. Am I right in this assumption?
How does it calculate the Withdrawals then?
Hi Omar,
The “Contributions” are calculated based on the aggregate value of all BUY transactions during your selected time period. As such, you’re correct that it takes into consideration reinvested capital.
The “Withdrawals” are calculated based on the aggregate value of all SELL transactions during the selected time period.
So for example, if you sell $5,000 of investments and then immediately re-invest all $5,000 back into new investments, you’d see $5,000 appear in both withdrawals and contributions.
Makes sense. So essentially if I want to quickly use the sheet to calculate net real deposits I can just subtract the Withdrawals from the Contributions, am I right?
Yes correct!
Appreciate the spread sheet. I was looking for something that I could combine the 8 different accounts that myself and my wife have. I used the cash method to track the cash in each account. The only thing that would be a bonus was if I could clock on one account in portfolio and the holding for it would come up. I apologise if I have missed it.
Hi Rod,
Unfortunately, there isn’t any way to filter the dashboard outputs to only show the values for a single account.
I will keep that in mind for a future version of the tool. Thank you for your comment.
Hey there,
First of all great spreadsheet. I’ve been using it for years to track both my Personal & Corporate investments. I’ve been moving my Google Sheets documents over to Office 365 and noticed the newish Stocks data type feature in Excel. Seems to have access to more obscure quotes (it has a Group RRSP fund that I could never find with Google Finance). Anyway I’m sure you get asked this a lot but I was just wondering if, with this new feature, you had an Excel version in the works?
Thanks again
Hi Patrick,
Thanks for your comment — glad to hear that the spreadsheet has been helpful!
I believe the Office 365 excel stocks feature only allows you to access current stock price info (rather than allowing you to query historical stock prices at any given date).
This current Google Sheets file automatically grabs current AND historical stock prices from Google Finance. Google Sheets has this integration, but excel does not.
The querying of historical stock prices allows the user to see the value of their portfolio for any date in the past, and also drives the investment performance calculations.
As such, this tool remains only as a google sheet version for now.
Thanks for the response. That makes sense. Guess I have at least one reason to keep using Google Sheets.
Hi there! This is a great tool and saves me tons of time! Keep up the great work!
I recently started doing some day trading and noticed the calculations for the Cost Base is messed up if there is more than 1 BUY (or SELL) of the same stock in the same day. The calculations correct itself if I manually change the date of the second buy/sell transaction to a different day.
Any ideas?
Thanks!
Hi John,
If you are buying and selling the same stock on the same day, the cost base calculations should work OK as long as you enter the transactions in chronological order (with the oldest transactions first).
So if you buy 5 shares of stock ABC and then sell 5 shares of ABC later that same day, enter the BUY transaction first and the SELL transaction second.
If you are still running into issues, can you share your spreadsheet with me by email? I can take a look and troubleshoot if so.
Hi John,
I looked into it a bit more, and realized there was a bug in the spreadsheet which was causing the issue you mentioned (incorrect cost base calculation for people who buy/sell the same stock multiple times during the same day).
I’ve adjusted the spreadsheet to fix this and have re-uploaded a new version 5.7. The link on this page will take you to the latest version. Now if you enter your day-trades in chronological order, everything should calculate OK.
Please grab a copy of the new spreadsheet and let me know if the issue persists.
Thank you so much for the quick response!!! I will give it a try!
Just wondering, why does choronological order matter in the calcuation? I changed the date of one of the day trades and it changes the cost base?
Thanks!
Hi – This an amazing spreadsheet and by far the best I have come across so far. I can’t imagine the amount of effort that must have gone into making this so sophisticated.
I noticed that if I square off a position, I am left with an unrealized gain per unit of the current market value which seems to be a bug (Column I on the Portfolio Holdings tab). Just needs a formula adjustment to account for 0 positions. This is accounted for in the total position unrealized gain, but all 0 positions still show a slight unrealized loss which after tracing through all the formulas i narrowed down to the adjusted cost base calculation. In the case of a sell order, the adjusted cost base post transaction (Column Q on the Trade Log sheet) is taking the pre-transaction per unit cost base for calculating the new cost base. I assume this is to prevent changes to the per unit cost which you only want to determine based on buys or revert cost to 0 for squared positions without accounting for any realized gains but this then leads to a leftover cost base for 0 positions equivalent to the trading commission on the sell orders. For non squared positions as well this will lead to excess cost build up of trading commissions without any adjustment on cost base for gains/losses made through selling at a different price. Although I understand that the spreadsheet is currently not looking to account for cash or realized gains, but this seems to be leading to incorrect unrealized gains calculation as well?
Separately, even if not automatically calculated and broken down to avoid major changes to the spreadsheet, would love to be able to enter my own values for realized gains and cash account balance which can feed into the portfolio graphs and calculations and also be used for re-balancing.
Appreciate your thought around this!
Thanks and have a good day
#StaySafe
Hi Piyush,
Thanks for your comment and the kind words.
To track your cash balance in the tool, you can try this workaround:
– On the “Setup” tab, add a new stock ticker called $CASH (or something else that doesn’t return a market value on google finance)
– Whenever you get extra cash in your account — dividends, contribution, etc., enter in a buy transaction on the Trade Log where you purchase X shares of cash at $1 per share (X being the total amount of added cash)
– Then, on the Your Portfolio Holdings tab, in the manual price entry column, input a value of $1 per share for your $CASH investment
– Now, you’ll see your new ticker $CASH, and the corresponding total $ amount reflected
– If you use up that cash, remember that you’ll have to enter a corresponding sell transaction
For the unrealized gain per share for ‘squared off’ positions, this was fixed in the newest version 5.7 of the tool which I have been tweaking yesterday and today. Please upgrade to the newest version and this should be fixed.
When you switch to the new version 5.7, the cost base should also be zero for all squared off positions. Trading fees for sell transactions were being added onto the cost base of the investment, which was incorrect. This has now been fixed in the new version.
Hiya! Thank you so much for putting this together. This is gonna be such a valuable resource as I begin my investment journey. Question — The “Contributions” section under Performance is showing up as $0. A bit confused as I correctly labelled all my transaction types as “Buy”. Is there a way I can resolve this?
Hi! Can you please check the dates in cell C54 and C55 of the Dashboard tab?
The performance calculations (and amounts listed for contributions, withdrawals, etc.) are done based on the date range in those cells.
Make sure that the end date (cell C55) that you’ve entered is after the date of your transactions on the trade log.
Hello! C54 and C55 are listed from the Feb 24, 2020 to Apr 24, 2020 range. All my Buy transactions as listed in the trade log are from Feb 24 2020 to Apr 3 2020. The contributions are still listed as zero. The “Status of Google Finance Quotes” is also all zero-ed out :/ Please advise! Thanks so much.
Can you share your spreadsheet with me by email? I can take a look and troubleshoot.
Hi! Funnily enough, I just made a brand new copy of the sheet, copy + pasted my data, and looks like everything’s working the way it should. I think I was messing around the account types in the ‘set up’ tab and removed the accounts that didn’t apply to me (I’m in Canada) and that was why the numbers weren’t showing up properly. Thanks for being so responsive!
Great! Using a fresh copy of the spreadsheet often solves issues.
Hi there
I am running into the same issue
Initially after weeks of entering data,contributions are always 0 and investment returns are off.
Now after making a new copy, contributions show a smaller number than what i have bought
for example – i have open positions of 15k on cost basis,,so shouldnt contributions be 15000?
instead it shows 3.5k and also unusually high number of investment returns (65%) —
I know i have maybe 15-20% of returns roughly..
So how are these contributions and investment returns calculated? and where can i alter them to be correct?
Thanks again
This rocks and super sophisticated.
On the Dashboard tab in the performance section, you can input a start date / end date, and the tool will show your starting and ending portfolio values for those dates. It’ll also show the “bridge” between the start and end values, where:
end value = start value + contributions – withdrawals + investment returns
Contributions are calculated based on the sum of all “buy” transactions from the Trade Log, for your specified date range. Likewise, Withdrawals are calculated based on the sum of all “sell” transactions during the date range.
Please double check your transaction entries on the trade log, and also the date range that you’ve specified in the Performance section on the Dashboard tab. Modifying the start date and end date will change the results.
I’ll say like everyone else…wow! I’ve been fiddilng making my own sheet, so I know the level of thought and SKILL that went into this.
My question is more on how you would set up the workflow (even if not using your spreadsheet) of my situation.
I live in Brazil. I earn USD. I consider that my base. But I bring over (buy BRL) and invest here. How you record the currency transactions? I currently have to 2 tabs, 1 for US trades and 1 for BRL trades. It’s simple enough for the stocks/bonds. But Im gettting stuck on the curency conversion. USDBRL or BRLUSD, and then the money is invest in an instrument BRL which also has a return. The question that I think Im trying to ask is how do I figure out returns on exchange and stocks, If i was to cash out and bring it all back to USD?
Any help would be greatly appreciated, not many people can even understand my question!
Hi Jon,
I noticed my question was the only one that you skipped over. Is it because you didn’t’ see it? Understand it? or is out of scope?
In case you didn’t understand.
Problem: I have 2 returns I’d like to track. The exchange rate purchase (when I buy BRL) and the return on the investments that that money buys in BRL (i know how to track this). Is that possible with your sheet as is?
PS: I bought you a coffee
Hi Jeff,
Sorry for the late reply — I missed your earlier question. And thank you for the coffee!
When you purchase BRL investments, record those as normal in BRL currency. If you select BRL as the main currency at the top of the Dashboard tab, your portfolio values and returns will be displayed in BRL. There will not be any impact of the BRL/USD exchange rate.
However if you want to see everything converted to USD, just switch the main currency at the top of the Dashboard tab to “USD”, and everything will convert. Your portfolio values will be shown in USD currency, and the return calculations will now factor in the change in the BRL/USD exchange rate.
I hope this helps.
Also FYI — my name is not Jon!
Hi,
Firstly, really appreciate the great work and your kindness to share the tool!!
I’ve been using another google sheet based portfolio tracker and it worked ok but it’s missing the performance tracking feature. After I found your file, I thought this is the one I will need (performance calculation, one master sheet to track all trading..etc) so I’ve moved all the data to your tracker and still trying out. One thing I found so far is that I used to include cash position from different account for my tracking purpose which was not included in your version.
I’ve read through the comment here and tried the $CASH method you suggested. It works in terms of including cash in the portfolio. However, it seems that the annualized performance will be impacted (as I can only enter the cash-on-hand based on today). I thought the suggestion from Investor A (back in Dec 2019) is a good one by just having user manually update cash in each account is a small nice feature. I wanted to try out but not sure if I’d mess up the file as your file is beyond what I can understand
Hopefully you will consider adding this soon. Meanwhile, I will evaluate the pros and cons or other workaround. Thanks again!
Hi Bradley,
You’re very welcome! The $CASH method should work both for tracking the current amount of cash on hand, and also the performance of your portfolio taking into account your historical cash balances.
You just need to enter a value of $1 for the $CASH row in all of the manual price entry columns on the Your Portfolio Holdings tab (columns H, AE, AJ).
In columns AE and AJ, you’ll see your cash values based on historical dates.
The performance calculations will take those values into consideration.
Hi,
Firstly, thank you very much for the spreadsheet, it’s incredible!
I’ve added a small fix to my copy which I think you may want to add to the public copy.
The issue is some market prices are quoted in cents. I see you handled this for GBP specifically, however it happens to be true for some other currencies.
I’ve solved this by doing the following:
1. In the setup tab next to the currencies I’ve added a new column:
Quoted in Cents
n
y
n
n
y
2. In the portfolio holding tab I’ve added a new column AB: =IFERROR(INDEX(Setup!$E$5:$E$9, MATCH($C7, Setup!$B$5:$B$9, 0), 1), “”)
to lookup the previous column value
3. in G, AD, AI I’ve updated the condition from $C7 = “GBP” to $AB=”y”
Pretty simple fix, but It would be nice to have it by default in future updates
Thanks again,
Jason
Hi Jason,
Great suggestion, and thank you for the detailed write-up of a solution as well! I’ve implemented that change in the master version.
Hi everyone! Just a quick announcement that I’ve published version 6.0 of the the tool today(!), with two new tabs: “Realized Gains” for tracking your profit/loss on sold positions, and “Dividends” which shows your history of dividends received broken down by investment account / category / currency, and a view of your current portfolio yield metrics.
Quite a few users had asked for these features over the past year or so. It took me a fair bit of time to implement those improvements (excuses, excuses…) but they’re available now!
I hope that everyone gets good use out of the new features. Happy tracking all.
Amazing! Thanks for the new addition!
Awesome! I had done a small hack in my version to cater for realized gains waiting for your proper version update. Will port over my data tmrw and report back.
Thanks
Piyush
Wow this is amazing! Thank you for making this!
You’re welcome
Today I was wondering where to see realized gains in the spreadsheet so I came here to check if it was somewhere I hadn’t noticed yet or if it had been suggested. And BOOM there was a brand new version with this feature added!! what are the odds. Thanks for the great work and sharing this!
Haha, good timing! Cheers, you are very welcome.
Mine seems to be pulling the wrong current share prices from Google on the ‘Your Portfolio Holdings’ tab. I can’t work out what I’m doing wrong?
Hi Stu,
Please see the “Frequently Asked Questions” section of this page, question #3 in particular!
So it’s pulling the correct prices but then saying on ‘Your Portfolio Holdings’ that I have an unrealised gain of over 10,000% on shares that have actually gone down in price. I can’t work out why.
Hi Stu, perhaps there is an error in the way you entered the buy / sell transactions on the trade log. Feel free to share your spreadsheet with me by email and I can take a look.
Hey I seem to be having a similar issue. For me it is with British pound stocks (actually the are denoted in pence, but this is not an option in XE.com). In the buy/sell tab values are entered in pounds, however in the your portfolio tab the values being pulled from google are in pence. Im not a google sheet wizard, so have no idea how to fix this
Hi Lex,
This issue is caused because Google Finance often quotes the market price of GBP stocks in pence rather than pounds. So, the spreadsheet values for the current stock price are over-stated by 100 times.
You can fix this by entering a value of Y on the Setup tab beside each of those stock tickers — in column G. This will cause the stock prices to be divided by 100 when they are pulled from google finance (converting cents/pence to pounds).
Please search your stock tickers on google finance to find out which are quoted in cents / pence.
https://www.google.ca/finance
I hope this helps.
Hi
Wanted to say a big thank you for this great tool. I searched the internet high and wide and this was the closest thing to what I was looking for.
Here in the UK google finance is so patchy for mutual funds that I had to go down a different route and have built my own separate pricing spreadsheet/database. This has turned out to be a massive undertaking (thanks lockdown!) but it means i have historical values. I may at some point even try and write a macro to iterate through my chosen time period one day at a time and log the total holding value so that I can plot portfolio value against time.
One small tip for cell G7 where you have added the “prices in cents” change. I think you can simplify your formula by dividing by this: /(IF($AR7=”Y”,100,1)) rather than repeating every element for the date range. e.g. this is what i have in H7 and it seems to work fine:
= IF($B7=””,””,VLOOKUP(Dashboard!$C$2,IMPORTRANGE(PRICES_URL,VLOOKUP(B7,Setup!B$52:E$500,4,FALSE)&”!$A$2:$B$1128″), 2, TRUE)/(IF($AR7=”Y”,100,1)))
Couple of questions:
1) How best to handle conversions/mergers? I tried selling the old outgoing units at zero cost and then buying the new units at zero cost which i figure aggregates out but it gives massive gains and losses at the individual unit level. The broker don’t actually tell me the prices for the transactions.
2) Is there an easy way to filter the figures/outputs/charts by account? It would be useful so that I can verify the tool is working by comparing against my brokerage reporting. It would also be good to be able to understand performance of the individual accounts in isolation since often they have different objectives and timeframes etc
Hi Steve,
For mergers, it would be best to buy the new ticker at the market price of the new shares on the day of the deal (e.g., bought 10 shares of XYZ at $30 per share, for a total of $300). Then, you’d enter a sell transaction to sell all of the shares of the old ticker for a corresponding total $ amount (e.g., sold 15 shares of ABC at $20 per share, also giving a total of $300).
You can probably get a decent estimate by searching the specific deal / looking at the market price of the new ticker on google finance.
Unfortunately there isn’t any way to filter by account currently. I’m hoping to add that in a future version.
Thanks for the tip on simplifying that formula — I’ll look into it.
Cheers!
After the sell/buy to account for the number of shares:
If the old ticker is no longer on google finance, do we have to manually enter prices when we look back at dates before the merger?
Also, currently, are manually entered prices fixed (the same regardless what date we look at)? So we’d want to go into Portfolio Holdings to change the value when we change the date we are looking at?
Hi Harrison,
Your understanding is correct. If a ticker is no longer on Google Finance, the manual price entry columns would need to be used. And yes, the manual prices are fixed by default, so you would need to change them as you change the dates.
If you have access to the historical stock price for that ticker through another data source like yahoo finance or otherwise, here’s a workaround to create an automated version of the manual price entries for tickers which don’t exist on Google Finance:
– Make a new tab in your sheet, and download the share price history for that stock (column for date, and column for closing price) — i.e., the data from your secondary source
– On the Your Portfolio Holdings tab, use a VLOOKUP formula in the manual price entry columns to pull the correct price from your share price database — you’ll need to add this formula in columns H, AF, and AL, using the appropriate date reference each time
The net result of all of this is that you’ll have created your own pricing database for the stock, and will be pulling in the correct prices through the VLOOKUP formulas.
Works great! Thanks!
I’m just manually writing down the reported share prices from my monthly statements, since they are “Collective Investment Trust (CIT)” inside my 401k.
I’ll be doing the same for treasury bills!
Makes perfect sense, that’s a good method. Cheers!
Hey! I have the same problem, mainly around the monthly performance script. I added a sheet with historical performance of my manual input, but am not able to find the right vlookup logic. Could you share how to include this? Thanks in advance
Hi Douwe,
Please try following this tutorial which explains how to create a vlookup formula across two different tabs: https://measureschool.com/vlookup-in-google-sheets/
On the Your Portfolio Holdings tab, you should be using the vlookup formulas that refer to your new Manual Price tab.
The relevant dates for the lookup can be found on the Dashboard tab (today’s date, and then in cells C53 / C54 for the start and end date of the specific return period).
Hi Steve,
I’ve found the same problem /w mutual funds (also from the UK) – would you be willing to share the spreadsheet you’ve devised to calculate the profit/loss?
My tip above refers to the “Your Portfolio Holdings” tab btw.
I’ve been checking this every few months for the realized return updated – it is life changing, thanks.
Cheers! Happy to hear it
Great work on the new features! it helps tremendously in keeping track the realized gain! I think I found a bug with the realized gains though. One of my stock had a reverse split but the Realized gain tab do not reflect the change completely. Specifically, only the “Cost base per unit” (col H) shows the reflect stock split, but column E, G, J and L is definitely off.
Gah! Good catch John.
Incorporating stock split transactions always makes the calculations trickier.
I’ve uploaded a new version 6.2 which should solve this issue on the Realized Gains tab. It’d be appreciated you could ‘upgrade’ to the new version and let me know if the issue is solved!
Cheers.
Thanks for the fix! Seems to be working now!!
Excellent! Thanks for letting me know.
Hi, this spreadsheet is incredible. I wish i had come across this one earlier.
I spent the last 6 hours adding in trade confirmations from one of my brokerage accounts a lot more accounts to go. What would you recommend i follow if i do not wish to enter in trade confirmations for an account starting with 0 value.
For instance, i have a fidelity 401k account where i have trades for about 5 years. After those 5 years passed i exchanged all the funds in that account to the brokeragelink account within fidelity in the past year or so. Now i entered in trades from only the brokeragelink account but since the initial amount is so high all the graphs are skewed. I do not wish to track the investment for the 5 years before and would like to only see the performance in the brokeragelink account.
Thanks for your response and all your hard work.
Hi K,
On the date that you transferred your investments from Fidelity to Brokeragelink, I’d recommend adding in buy transactions for each of the investments that were transferred.
For each ticker, enter the appropriate quantity of units, and the estimated market price on that day — you can get historical prices from Yahoo Finance.
This will let you measure performance accurately from that date onwards.
Hey mate, really enjoying working with your spreadhsheet. I just noticed this Total row in the Portfolio Holding tab, what is this row supposed to show? Is it broken in my sheet?
https://snipboard.io/ADoztS.jpg
Hi Omar,
Just scroll a bit more to the right on that sheet! It will show totals for the currency converted values.
Totals are not shown for the “local currency” values since some investors own investments in different currencies. Adding up 5,000 yen to 200 U.S. dollars would be a meaningless total.
Ah, DOH!! Missed that completely. Very nice touch having the totals in one place. Cheers
Hello again,
I have a small feature request (hopefully). I see the asset allocation in the Re-Balancing tab gets changed, the order, based on how much is allocated to each category. This can sometime mess up my % allocation if say an asset class surpases another due to market fluctuations and I have to be often correcting the % allocation for those classes. Its not a huge issue, just a small annoyance, but would be great if it didn’t shift. Thanks in advance!
Hi Omar,
Not sure I understand the question fully. From my perspective, the re-balancing calculations should take into account market fluctuations.
For example, let’s say that I start out by investing my money in 80% stocks, and 20% bonds. I’d like to keep this allocation as time goes on. If in the future stocks outperform bonds, my allocation may shift to 85% stocks / 15% bonds instead. Now, what I should be doing is to sell stocks and buy bonds in order to re-balance everything to my original target allocation. Alternatively, I should be investing my new money into bonds to get the proportions back in line with 80/20.
The re-balancing page of the tool will help me figure out how to do that.
Let me see if I can explain myself better this time. What I mean is that the order that the categories are displayed in the Rebalancing tab shifts around sometimes. For instance lets say I assign the following allocation % to each of the following 5 categories:
https://snipboard.io/x2Q3h4.jpg
The problem that I encountered is that sometimes the order for the investment categories will shift from time to time. For instance right now Long Vol is 4th and Fixed income is 5th. This could shift and Long Vol drops to 5th row and Fixed Income goes to 4th. This screws up my $ allocation as they are no longer aligned to the correct asset class. I think what causes the shift is this list is ordered by the value in Column C, so if one asset class surpases another either because of changing market prices or because of a buy/sell operation then they will shift and you will have correct the $ allocations. It’s rather annoying on a second spreadsheet that I have with more categories and the asset values are closer together (so they can shift around multiple times in day.
Hi, just a quick question on the realized and unrealized performance measures – do any of the return calculations include dividends? If not, is there a way to easily include them?
Thanks!
Hi Brendan,
The realized and unrealized performance metrics for each stock do not include dividends. This is standard from my experience.
You can see the amount of dividends received for each stock on the “Your Portfolio Holdings” tab. There is a column for that.
Also please note that the total portfolio returns shown on the dashboard include the impact of dividends.
I just confirmed its the value in Column C that determines the order of the investment classes. Just did a buy operation to increase the value of my Fixed Income, and now it jumped from the 5th to the 3rd row:
https://snipboard.io/cGoB6P.jpg
Since the % allocation don’t shift this causes them to be misaligned.
Perhaps this could be fixed by having a separate box where you define the % for each asset class, or that the asset class do not get automatically sorted by value.
Hi Omar,
I see what you mean now, and you’re totally right! I’ve fixed this issue in version 6.3 which I just uploaded.
It was a simple fix to show the investment categories in the same order as the user enters them on the “Setup” tab. This means that the order of the categories will stay static regardless of the day-to-day market fluctuations.
Thanks!
Hi
I am trying to get started but have some problems/questions.
1) Where do we see the current market price for the stock?
2) How do I start a portfolio with the initial investment. ie how do I enter it? The money is coming from a money market account in the brokerage. How do I enter this?
3) In Portfolio holdings: market value doesnt appear correct [I entered the stock correctly in the input page and it updated it correctly].
4) In the same page it says not converted to local currency. How do I do it?
5) Also see the first stock value is zero, but other have updated? Where is it going wrong?
Thanks.
Hi David,
Please see the Frequently Asked Questions section of this page, this should answer a few of your questions!
The “Your Portfolio Holdings” tab shows the current market value per ticker. The date of the market price is controlled based on cell C2 of the Dashboard tab. Make sure to change this value to the date you want.
On the Your Portfolio Holdings tab, you can see the local currency view and common currency view. There are two sets of columns. Just scroll to the right to see the common currency views.
This sheet wasn’t built to track cash, but you can try a workaround that I suggested in a previous comment. Do a search for $CASH in the comment section.
Hey, awesome work with the spreadsheet. Super duper helpful. I have 2 questions:
1) I am not entirely sure how to use the “Performance of your investment portfolio” in the “Dashboard” tab effectively. I only started investing last year and am basically managing my wife and my TFSA accounts. I know exactly how much funds I have put in both those accounts and I know that they are not above the max limit. But when I pick the dates to have a look at my performance from the day I started investing (basing it on the first logged trade (Mar 2019) to today (June 6, 2020), the amount of “contributions” is way above what I have in both the TFSA accounts combined. And my money weighted annualized return is also far above that what I would imagine my return has been over the past ~1 year. So I am not sure what I am doing wrong here. Any suggestions or clarifications?
2) Is there a way to input a cash position somewhere? I usually count any cash sitting in the brokerage account as part of my portfolio and count it towards calculating % of each holding. Also I keep a % of my portfolio as cash as part of re-balancing. Wondering if there is a way of incorporating that somewhere in the spreadsheet.
Thanks a lot again for all your hard work.
Cheers!
Hi Mohit,
1) The spreadsheet considers all buys as “contributions”, and all sells as “withdrawals”. So, if I buy $5,000 worth of stock, sell for $5,000 next month, and then re-invest the money in a different investment, the spreadsheet would show $10,000 of contributions and $5,000 of withdrawals. This is different from the TFSA definition of contributions, which would only consider the initial deposit of $5,000 to be a contribution.
For the % return, hard to pinpoint without seeing your specific spreadsheet, but please check the “Your Portfolio Holdings” tab to see if any of the figures look odd. Perhaps there was in incorrect input on the Trade Log tab?
Also see the Frequently Asked Questions section of this page. If you are still having issues, feel free to share your spreadsheet with me via email and I can take a look.
2) This sheet wasn’t built to track cash positions, but you can try a workaround that I suggested in a previous comment. Do a search for $CASH in the comment section.
Thank you for the reply. I will play around a bit to see if I can input something incorrectly.
May I ask what the benefit might be of seeing your contributions and withdrawals?
Any my apologies for not reading through the comments before asking about $CASH. You have clearly answered the query multiple times.
Cheers!
Hi Mohit,
The contributions and withdrawal metrics are useful to explain how your account got from the starting value to the ending value.
For example:
– On Jan 1 2019, I started with $5,000
– Throughout the year of 2020, I contributed $3,000 (sum of all buy transactions)
– Also, I withdrew $1,000 (sum of all sell transactions)
– My investments earned $500 in returns
– Therefore, my portfolio ending value is $7,500 on Dec. 31, 2019 (5000 + 3000 – 1000 + 500)
Thank you so much for this kickass spreadsheet! It’s done really well, far better than anything else I’ve seen online.
I have a request for a future version. Could you add the ability to specify a cost basis during a ‘Sell’ transaction? I track my trades as separate tax lots, so if I tax-loss harvest or tax-gain harvest specific lots, my realized gains or losses won’t be reflected accurately.
I’m not sure the best way to implement this, but one idea would be to add an optional column (similar to the Split Ratio feature) that would allow you to specify the original cost per share.
A slightly more complex option, to better support the TLH or TGH scenarios, might be to instead add a column to allow users to assign an optional tax lot / spec ID to trades. Users can assign one in Buy transactions and if specified in a Sell, the formulas would use that lot’s basis to calculate gains/losses. It might be tricky if you want to add validation, but you can probably skip it for the first iteration as I doubt it’s common enough issue to be worth the effort (eg, ensuring that people don’t accidentally try to sell more shares than purchased – either in one buy-sell or one buy & multiple partial sales of the tax lot).
I’m really grateful I came across your site!
Nick
On second thought, the first option might be more flexible. It would allow new users to more easily use it without requiring old trades to be added.
For those like me who would appreciate having a lot ID associated, it might be enough to have a ‘Notes’ column to be able to capture the lot IDs assigned in a buy or used in a sell.
Nick
Hi Nick,
Thanks for your suggestion. I’ll add that to my list of future improvements. Adding a column for users to input a manual override for the cost base should be doable!
1. How to get XIRR for each stock?
2. Is it possible to incorporate goal planning along with these sheets?
Hi Mukesh,
Unfortunately the sheet cannot calculate XIRR for each stock at this time. That feature is only available for the entire portfolio, and for your specific investment categories. You can see these metrics on the Dashboard tab, in the performance section.
I’m not quite sure what you mean by goal planning, could you elaborate further?
Hi,
Goals like retirement, education etc. I was thinking with this feature in the tracker, it would be easier to see how the asset allocation is needed etc.
Hey,
I noticed that the unrealized gains columns are not matching when my USD securities are converted to CAD. Although it looks like the quote is converted appropriately using the conversion multiple, the cost base conversion from USD to CAD is off, thus changing the % of unrealized gains. Any thoughts there?
Thanks!
Hi Mohit,
The market values for each ticker are converted using today’s exchange rate.
However, the cost base calculation uses the currency exchange rate on the date that you made the trade. In my opinion, it is most accurate this way as it records the cost base in your home currency as of the date that you made the trade, rather than today’s rate which might have fluctuated.
I hope this helps!
Hello there — this is really great—finally found the tracker close to personal amazing track—been waiting for a few years looking for this and working on idioitic/self created versions…
1)–the realized gains portion doesnt seem to be working inspite of entering all the details on trade log…
2)also for past trades–is there any way of skipping the whole thing and editing directly in realized gains/losses per ticker??
please ignore–realized gains is working–i had accidentally fudged with the formula—all good…
if I already did 100 realized trades,,is there anyway I can skip the trade log and editing directly in realized gains/losses per ticker???
Just 1 more question—love the spreadsheet again—as i enter so much data and made a few copies as you suggested if there are inputting errors—–
The dashboard/performance breaks if I enter a date in June but as long as I enter a date <May 31st –the dashboard and performance /numbers all start working… so we wouldnt know the performance on a daily basis and is this for each month end by month?
Thanks again…
A donation will make it to you shortly..
Hi!
There isn’t any way to directly enter the realized gains. However, you can easily reflect this by entering one buy transaction / one sell transaction for each ticker. If the position is fully closed, you can just enter the total $ amounts (rather than $ per share / # of shares) to speed up the data entry. For example, bought for $100 and sold for $150, giving a total realized gain of $50.
For your question about the Dashboard / dates in June, that is strange! The tool lets you view any date — not just month end values. Could you try refreshing your copy of the spreadsheet again as per question #5 in the Frequently Asked Questions section? That should do the trick.
If you still run into issues afterwards, feel free to share your spreadsheet with me by email, and I can take a look.
I hope this helps!
Hi
MS 365 released MS Money for free in Excel. Do you think you can incorporate your spreadsheet in this? Because MS Money can auto login to your bank and investment firm and download instead of manually typing in.
Just a thought. To make your spreadsheet better and easier to use.
Thanks for the heads up — I hadn’t heard about that!
Unfortunately I don’t have a subscription to Office 365 software. I am still in the relative dark ages with excel 2016…
If I get a subscription to 365 in the future, I will definitely keep this mind and try to integrate that functionality.
Cheers!
I typically don’t ever leave reviews, but this spreadsheet is so amazing that I NEED to.
First of all – thanks for putting work so I don’t have to.
Only question is – under trade log, it says to enter the amount in local currency. I am using CAD as local currency and have stocks in USD. Should I convert USD –> CAD before entering them in trade log?
Please let me know.
Btw, sent a coffee your way. Enjoy! Definitely deserve it
Thanks Pratik, I really appreciate the ‘review’ and the coffee
There’s no need to convert manually. Just enter your CAD stocks in CAD$ amounts, and your USD stocks in USD$ amounts — the spreadsheet will handle the currency conversions.
LOVE this spreadsheet and it is by far the best one I’ve worked with yet! Thank you so much for all the time you’ve put into this.
I do have two suggestions/requests:
1) When reordering the tickers on the Setup tab, it automatically reorders them on the Your Portfolio Holdings tab too, which is great. However it does not carry any Market Value manual inputs along with the reordering so they get misaligned.
I have a few crypto holdings that I have manual inputs for and anytime I had a new ticker and reorder them alphabetically (what I like to do) it means I have to go and reposition the manual inputs.
2) Perhaps this one is also a question if there’s a direct answer. I recently got to the point where I had to add another 1000 rows to the Trade Log tab. When I did this I noticed it didn’t carry the formatting from the previous rows. To fix this I simply grabbed my last formatted row (without data) and dragged it over all the other rows to apply the formatting. This worked just fine but I then discovered several areas in the Your Portfolio Holdings tab where it looks like some formulas are hard-coded using the previous max number of rows that I had (e.g. the Quantity of Units in column E has something like this …SUMIFS(‘Trade Log’!$AD$5:$AD$1988… capping it to the 1988th row.
Perhaps these formulas can be adjusted such that they look from the first row of data all the way to the end of the sheet. This could probably be accomplished using the OFFSET function. Or, if the example row at the very top is removed you could just specify C:C to look across all of column C for example.
Hi Kyle,
Thanks for your comments and suggestions!
On #1, I can’t think of an elegant way to transport those manual inputs to a new row if re-ordered, but I’ll keep it in mind.
On #2, this should be doable! I will test out just using the C:C formulas, and will try to incorporate in the next version.
Cheers!
Hi Kyle,
A quick update on this.
I’ve just uploaded version 6.4 of the spreadsheet, where I’ve adjusted the sheet for your point #2 above.
The formulas that reference the trade log tab now look across the entire columns, rather than a hard-coded range.
This should make it easier to add new rows to the Trade Log.
Please note that there are several formulas on the Trade Log tab that are hidden from view. You will need to expand those columns (click the + sign at the top right of the spreadsheet), and then you will need to copy/paste those formulas down for any of the new rows that you add.
I hope this helps!
Amazing! Thank you so much for adding in this change and for doing it so quickly too!
Kyle
Hi there,
The tracker is superb. I just have a question regarding the cash deposit and cash balance. For example, on Day 1, I deposited 100,000 USD, then I buy and sell stocks, but did not use all 100,000USD. How I should reflect on the cash balance? Also how I should reflect future cash deposits and withdraw? Thanks a lot.
Best
Simon
Hi Simon,
Check out question 7 in the Frequently Asked Questions above. I believe that should answer your question.
Happy investing!
Kyle
Hi Simon,
As Kyle mentioned, please see question #7 in the Frequently Asked Questions section of this page.
To Kyle, thank you for pointing that out!
Hi there,
first off, fantastic work!
This is exactly what I’d been looking for, and you nailed it.
Whilst it works great for my US stocks, it can’t seem to find anything that I trade in GBP.
To be fair I also cannot find these funds in Google Finance either. Any ideas on what I’m doing wrong?
They don’t have traditional symbols, some are only searchable by ISIN, and I tried searching using both LSE and FTSE tags before the ISIN or name.
Any advise would be greatly appreciated.
Here’s a snapshot of what I can’t find.
Thanks
VANGUARD US EQUITY INDEX ACC
https://www.hl.co.uk/funds/fund-discounts,-prices–and–factsheets/search-results/v/vanguard-us-equity-index-accumulation
POLAR CAPITAL GLOBAL TECHNOLOGY INCLUSIVE – CLASS R – INC
https://www.hl.co.uk/funds/fund-discounts,-prices–and–factsheets/search-results/p/polar-capital-global-technology-gbp-income-inclusive
FIDELITY GLOBAL TECHNOLOGY CLASS W – ACC
https://www.hl.co.uk/funds/fund-discounts,-prices–and–factsheets/search-results/f/fidelity-global-technology-w-gbp-accumulation
AXA FRAMLINGTON GLOBAL TECHNOLOGY FUND CLASS Z – INC
https://www.hl.co.uk/funds/fund-discounts,-prices–and–factsheets/search-results/a/axa-framlington-global-technology-class-z-accumulation
AXA Framlington Global Technology Fund
Inclusive – Class R – Acc
https://www.hl.co.uk/funds/fund-discounts,-prices–and–factsheets/search-results/a/axa-framlington-global-technology-accumulation-inclusive
Baillie Gifford American
Inclusive – Class A – Acc
https://www.hl.co.uk/funds/fund-discounts,-prices–and–factsheets/search-results/b/baillie-gifford-american-accumulation-inclusive
MNG
https://www.hl.co.uk/shares/shares-search-results/m/m-and-g-plc-ord-gbp0.05
Again, thanks in advance for any guidance here!
Hi Noobey,
This spreadsheet integrates with Google Finance to pull the latest market prices for each ticker. Unfortunately, if the ticker isn’t available on Google Finance, you won’t be able to use the tool to auto-pull those prices.
I checked your first fund (VANGUARD US EQUITY INDEX ACC), and wasn’t able to find it on google finance either.
However, you can use the manual input columns on the “Your Portfolio Holdings” tab to feed the market value of those investments. After that, those investments will be included in total portfolio value / all other calculations.
Thank you for this. Really loved it.
Just one question. If I sell some stocks, but use that money to buy new stocks, meaning that I never withdrawed money, what option should I choose in trade log? Because If I select “Sell”, the dashboard marks it as “withdrawal”
Hi Ricardo,
Whenever you buy stocks, record them with a “buy” transaction.
Likewise, when you sell stocks, use a “sell” transaction.
For the purposes of calculating contributions, the spreadsheet sums up all buy transactions. Withdrawals are calculated by summing up all sell transactions.
If you sell some stocks and immediately re-invest the proceeds, you’ll have a corresponding withdrawal and contribution amount that will net off to zero. As a result, all other performance calculations will run fine.
When looking at Open Positions on my Roth IRA, I see Total Gain/Loss and it lists it at 58% total gain. But on the spreadsheet it is 31%. Why is this different?
Hi Minjah,
It’s tough to pinpoint the disconnect without seeing your spreadsheet and your specific inputs.
Please double check your transaction entries on the trade log, and also the date range that you’ve specified in the Performance section on the Dashboard tab.
Also, you can try grabbing a fresh copy of the spreadsheet in case some formulas were accidentally deleted in your version. See the Frequently Asked Questions section — question #5.
The spreadsheet does not seem to handle fractional shares correctly. Am I doing something wrong?
Ditto for what Doug is saying, the stocks that have splits for my v6.4 sheet aren’t selling correctly
Hi Brendan,
Can you try using a fresh copy of the spreadsheet? If that doesn’t work, please feel free to share your spreadsheet with me by email and I can try to troubleshoot.
Hi Doug,
The sheet should handle fractional shares fine. However, by default, the spreadsheet is rounding everything to zero decimals — this is just for visual output, the actual calculations use the full decimal count.
For example, if you input a buy transaction for 10.4 shares, it will show up as “10” on the Your Portfolio Holdings tab, but all calculations should be using 10.4.
I think that if you just change the visual formatting to add one decimal point in column E of the “Your Portfolio Holdings” tab, you’ll see the correct amounts.
https://www.solveyourtech.com/increase-number-displayed-decimal-places-google-sheets/
I hope this helps.
Hi, I recently updated the spreadsheet from 5.6 to 6.4 and noticed there are now differences in how the return is calculated for a specific period in the dashboard (cell G78) – it seems the calculations in 6.4 are showing incorrect results – e.g. the first year of my portfolio it shows negative result (in 5.6 it is correctly positive). For some other years it shows oddly high numbers (e.g. 9% vs 6.36% or 63.8% vs 22.32%). Both versions of the spreadsheet have the same data in them and I am using Jan 1st do Dec 31st on each year for comparison.
Hi Free,
Can you try upgrading to version 7.0 to see if this fixes the issue? There were some bugs in the formulas in version 6.4 — I tried to simplify some formulas but ended up messing up a couple things…
Things should be OK in the current version 7.0.
Thanks for the update.
Seems much better in version 7.0 for annualized returns (Jan 1 do December 31).
However non-annualised seems to be off still.
For example If I look at the first year for which I have bought stocks (first purchase in late Feb) cell G78 displays 20.1% (and correctly states this is non-annualised return). However the value in cell G114 displays 13.9% and this is actually the correct value. I believe the values in these two cells should be equal for non-annualised returns?
Hi FS,
I’m not sure I completely follow. I think it’d be easier to figure it out if we both looked at the full details.
Feel free to share your spreadsheet with me by email, and I can try to troubleshoot!
Hi, apologies for the delay in my response. I was away for while. I just downloaded the latest version of the spreadsheet and see you have already fixed the issue I raised in ver. 7.3.
Hi, is there any way to enter the TD ESeries funds in the setup page?
Hi Matt,
Unfortunately the tracker will not be able to automatically grab the prices of investments that don’t appear on Google Finance.
However, you can still reflect these funds in the tool by entering the market price manually. You can do that in column H of the “Your Portfolio Holdings” tab to incorporate these e-Series funds in the current value of your portfolio. If you want to do performance tracking, you’d also need to input the values in columns AE and AJ of the same tab.
I hope this helps.
Fantastic spreadsheet. Far better than any other I have found online. I have one suggestion though. Have you thought about adding a “time-weighted return” in addition to the money-weighted return? Not sure if it’s feasible, but it would sure be helpful to see what my return is without the distortion of my inflow/outflow of cash.
https://www.investopedia.com/terms/t/time-weightedror.asp
Hi Andrew,
I’ve actually just uploaded version 7.0 of the spreadsheet yesterday, which adds a new tab “Monthly Performance” to track the month-by-month performance of a user’s portfolio.
This tab also includes an estimate of time-weighted return over the life of a portfolio. It’s only an estimate because it uses ‘valuation dates’ at every month-end. A true time-weighted return calculation would require the portfolio to be valued at each trade date.
Hi, 1st off, thank you so much for the spreadsheet, its been a wonderful help to keep track of my investments! This is one of the best trackers I’ve seen out there!
2nd, how would you enter calls or puts or other trade options on the sheet? I tried entering it in the trade log as 100 quantity of units for a certain price but in the end, i realized that it messed up with the realized gains tab (etc… entered in buy 100@1.55 & sold 100@1.65 but realized gains show loss of 218?)
Hi Ray,
This tool was built with fairly ‘vanilla’ investors in mind (buying and holding individual stocks or ETFs), so unfortunately it does not handle derivatives well.
I haven’t tested it out, but I think that this solution may work:
– Add a new ticker symbol (e.g., AAPL.CALL if you are selling calls on Apple)
– When you sell a call, add a sell transaction on the AAPL.CALL ticker (reflecting the premium received)
– When the call is exercised or expires, enter a buy transaction on AAPL.CALL at the price at which you pay out ($0 if the option expires)
I hope this helps.
Firstly, I want to thank you for creating such a brilliant tool! Lets me organize things so elegantly with all details. Really appreciate the effort.
How do you save 401k contributions using this sheet? For all trade logs, it asks for a symbol. Do we just create a dummy symbol like you mentioned for cash?
Also, when I create a dummy for cash, it doesnt get updated in the dashboard. I only still see just my stocks. Any recommendations on debugging it?
Hi Ameya,
You are welcome!
The tool is meant to track your actual investments held, rather than you contributions to various accounts. I think the easiest way to track your 401K contributions would just be to start a new tab and record the date / $ amount each time you contribute money to the account.
For the $CASH workaround, not sure what the issue could be. When you added the $CASH ticker, did you also tag it with “Cash” as the Investment Category? Feel free to share your spreadsheet with me by email, and I could take a look to troubleshoot.
Great tool! I also have a question about 401ks (fees). I use vanguard and when vanguard takes a fee, they reduce the number of shares I own (at a certain share price). How would I add this info to the sheet? Should I sell those shares and also include the $ total in the fee column? Thanks!
Hi Ben,
Strange! I’ve never heard of fund providers taking their fees by selling some of your shares. Typically, the fees are deducted directly in the stock price — i.e., you keep the same share count over time, but the fees drag down the price performance by a bit each year.
That being said, I think your method should be OK (i.e., entering a SELL transaction, where the trading fees are equal to the total proceeds).
Thanks for asking this. I was getting ready to ask this very same question (yes, even Vangard). Has the solution of “entering a SELL transaction, where the trading fees are equal to the total proceeds” worked? I have years of this to enter and if it isn’t a good solution I don’t want to go to all that effort.
BTW, to TMOP creator, this spreadsheet rocks!
Hello,
I used the $Cash and tagged it as “Cash” – works great, except for the rate of return calculations. Somehow money weighted rate of return is showing some huge percentages in 100s. I am using current and past unit value of $1 per $Cash in the Porfolio tab and would have expected it to show 0% rate of return. Thoughts?
Sal
Hi Sal,
If you have inputted a value of 1 in the manual price columns on the Your Portfolio Holdings tab (H, AE, AK), and are only using BUY and SELL transaction types for your $CASH ticker, everything should be calculating OK.
Can you please try a spreadsheet refresh, as detailed in the Frequently Asked Questions section of this page, question #5? That will fix any issues that might have been caused by accidentally deleting formulas in the sheet.
If you still have issues, feel free to share your spreadsheet with me by email, and I can try to troubleshoot.
How do I input stock splits like APple?
Hi,
To enter a stock split, you just need to enter a transaction on the trade log with the following details:
– Date of split
– Ticker (e.g., AAPL)
– Split Ratio — new shares per old shares — e.g., you would enter “2”, if you received 2 new shares for each existing share you held
Hi,
I have encountered for the first time a reverse split of 1:25, however when entering the data in the sheet, it doesn’t accurately reflect the sale price and realized/unrealized gains.
example:
Buy – 100k shares
Split – 1:25 = 4000 shares
After selling the 4000 shares, it still shows that I own 1903 shares and the unrealized gains is incorrect.
Appreciate your feedback to correct this.
Hi Ted,
Reverse splits should work fine in the spreadsheet. I just tested an example in my own version of the sheet:
– Buy 100 shares on 01-01-2020
– Split occurs on 06-01-2020 (with a split ratio of 0.04)
– Sell 4 shares on 08-01-2020
The spreadsheet then showed that I owned zero shares as of today.
Can you please try a spreadsheet refresh — as detailed in the Frequently Asked Questions section of this page, question #5? That will fix any issues that might have been caused by accidentally deleting formulas in the sheet.
If you still have issues, feel free to share your spreadsheet with me by email, and I can try to troubleshoot.
Great job!
How do you suggest to populate data for stocks that existed earlier and dont anymore. Either merged with another public company later or filed bankruptcy?
I created another tab with historical stock prices for stocks that are no more alive (LinkedIn, US Airways etc.) and did a quick vlookup on the “Your Portfolio Holdings” tab in the manual input columns H, AE and AK. It works!
That’s a great fix! Nice work, will keep that one in mind.
Splits are working fine going forward, but if you do a lookback analysis pre split date, the googlefinance stock price shows post split adjusted pricing vs. the qty input in the Trade log is pre-split. Any suggestions?
Hi Sal,
I made a revision in version 7.2 (just uploaded a few days ago), which should address the issue of google using post-split adjusted pricing even when looking back at historical dates. Basically I added a new “Split Multiplier” column to adjust for this.
Please upgrade to the new version — hopefully it fixes the issue!
Please elaborate on how to enter date for split. In my case tesla 5 to 1 split. previously held 5.201614 shares now i hold 26.00807 shares. How would enter this data?
Hi Tony,
To enter a stock split transaction, you need to input the following information on the Trade Log tab:
– Date when the split occurred
– Transaction type of SPLIT
– Stock ticker
– Split Ratio (new shares per old share)
I believe that the Tesla stock split came into effect on August 28th, according to this press release:
https://ir.tesla.com/news-releases/news-release-details/tesla-announces-five-one-stock-split
Therefore, you need to enter: 08-28-2020, SPLIT, TSLA, 5
This will increase your amount of shares held of Tesla stock by a multiple of 5 times.
Hope this helps!
What’s column J of the Trade Log for then? “Split Ratio (new shares per old share)”. Should we leave it empty?
in the new line split for the TESLA split, we only enter 5 (regardless of the number of TSLA stocks we have), and leave empty column F “Amount per unit”?
Hi Line,
To clarify my comment above — to enter a split transaction, you need to input the following information on the trade log:
– Date when the split occurred — in column B
– Transaction type of SPLIT — in column C
– Stock ticker — in column D
– Split Ratio (new shares per old share) — in column J — this would be a value of 5 in the case of Tesla’s recent split
You can leave columns E through I empty.
Got it! Thanks
Hi, can you confirm that we enter the split number on column J, and leave columns E through H empty?
Hi Josh,
To clarify my comment above — to enter a split transaction, you need to input the following information on the trade log:
– Date when the split occurred — in column B
– Transaction type of SPLIT — in column C
– Stock ticker — in column D
– Split Ratio (new shares per old share) — in column J
You can leave columns E through I empty.
I sincerely appreciate all your effort on this sheet with consistent update. It really help me to manage my portfolio. The performance tracker is what I really wanted, and it is now embodied! I hope you to have big success in your investment
Thanks Chris — much appreciated! Best of luck with your investments as well
Hi,
Wow, just an amazing tool to track investments. I appreciate this so much! And thanks for providing it to everyone.
Everything is working perfectly, but I do have one hiccup and haven’t been able to figure out the issue.
For one of my investment categories, it is showing a money-weighted return of 3415.9% (in the Performance by Investment Category section). There is only one stock in this category so not sure if that makes a difference or not. While I wish the %return were true, it is definitely not. This is what was the only entry in the Trade log for this particular category:
Trade log: LAC – 909 shares purchased at 4.10$.
Setup: LAC – Currency USD – Category materials
So not sure why it’s showing such a high percentage return. Any ideas?
Thanks!
Hi Pierre,
Great to hear that the tracker has been useful for you
Can you please try a spreadsheet refresh — as detailed in the Frequently Asked Questions section of this page, question #5? That will fix any issues that might have been caused by accidentally deleting formulas in the sheet.
If you still have issues, feel free to share your spreadsheet with me by email, and I can try to troubleshoot.
Appreciate your response. I tried doing a refresh however the issue has persisted. I shared a spreadsheet with you to see if you could troubleshoot. Thanks so much again!
I’m confused as to how to enter a dividend transaction. For example, I received $41.01 dollars as a dividend. Then, 1 share of VGRO was bought for 25.32 as a dividend reinvestment. I understand to do 2 separate transactions but I don’t know where to input the information. The first transaction should be labeled dividend. But what do I put for “quantity of units” for the dividend? What do I enter for “amount per unit” and “total amount” etc?
Another question I have is that I filled out my entire log of transactions since I started investing. Under the “your portfolio holdings” it says I have 800 units of XGRO and “(3)” units of VGRO, when in reality I have 806 units of XGRO and zero units of VGRO as I sold all of my shares of VGRO. I checked my transactions and they are correct. On the “trade log” page, my units add up to 806 for XGRO and zero for VGRO so I’m not sure why there is a discrepancy on the “your portfolio holdings” page. Thanks so much for your help!!
Hi Katie,
I can answer your first question. To log your dividends, add a “Dividend” labeled transaction and put in the amount you received under “Total Amount (before trading fees)”. You don’t have to fill in “Quantity of units” or “Amount per unit” for dividend transactions.
Hope this helps,
Ilyess
Exactly — thank you very much Ilyess!
Hi Katie,
For your question about dividends, the answer provided by Ilyess is exactly right — thank you Ilyess! You just need to enter the total dollar amount for dividend transactions (e.g., $41.01). Then, if you re-invested that dividend, you add another BUY transaction.
For your second question, can you please try a spreadsheet refresh — as detailed in the Frequently Asked Questions section of this page, question #5? That will fix any issues that might have been caused by accidentally deleting formulas in the sheet.
If you still have issues, feel free to share your spreadsheet with me by email, and I can try to troubleshoot.
Thanks for sharing this sheet and continuing to upgrade it – it’s a great piece of work.
Two questions:
1. How would you recommend treating interest received (e.g. from GICs or as unit holding distributions)? Best I could come up with is to enter it as a Dividend transaction (and rename a couple of graphs/column headers to “Dividends & Interest” for my own clarity).
2. Have you run across any way to trace precedents & dependents in Google Sheets? I rely heavily on it in Excel and would normally use it to figure out an unfamiliar spreadsheet.
Thanks!
Hi Fitzy,
For question #1 — I think your method of inputting interest received as “Dividends” is the best path.
For question #2 — after some searching around, unfortunately it seems that the feature for tracing precedents / dependents isn’t available in google sheets. It’s a shame because I also use that quite often in excel.
Some links that might be useful…
Tips on auditing formulas in google sheets: https://infoinspired.com/google-docs/spreadsheet/formula-auditing-in-google-sheets/
If you’re willing to implement a small script to do the job: https://medium.com/swlh/5-simple-steps-to-trace-cell-precedents-in-google-sheets-using-apps-scripts-af1ab3533d66
I hope this helps!
Hello awesome spreadsheet updates as always.
The money weighted return for silver is 300%
I can’t figure out why…
Please help!
As well I will be tipping you for this awesome tool as well. Proved invaluable.
Hi SC,
Can you please try a spreadsheet refresh — as detailed in the Frequently Asked Questions section of this page, question #5? That will fix any issues that might have been caused by accidentally deleting formulas in the sheet.
If you still have issues, feel free to share your spreadsheet with me by email, and I can try to troubleshoot.
Also, any donation would be greatly appreciated, thank you very much!
Ya the same result. I’ve triple checked everything as well. I just shared with you if you don’t mind taking a look.
Thanks!
Nice spreadsheet! Thanks!
Dividend reinvestment: I don’t want to enter two transaction. It’s doubling data entry.
I added a DividendReinvestmentCombined transaction type, and am adding the additional criteria to the various formulas.
Hopefully, something like it will be added here at some point.
Thanks Troy — agree that a combined dividend reinvestment transaction type would be helpful.
I’ll keep in mind for future versions.
Cheers!
Amazing tool, is there a way to increase the number of portfolio holdings to more than 150. I know my portfolio has become a mess and i am hoping this tool can help iron out and drop most of them.
If not, may i request that improvement in your next drop
Thanks
Hi,
As it stands, the max number of holdings is 150. I’d prefer not to increase the limit as the spreadsheet already runs fairly slowly as it is. I will keep it mind though.
Thanks for the comment.
+1 for increasing the 150 limit. I have bunch of stocks which I have sold entirely, but have to maintain in the 150 list, otherwise I don’t get realized profit/loss numbers among other things.
I would also appreciate to increase this limit.
perhaps a solution could be to add a closed holding tab which will no longer pull active data in?
+1 for increasing the max of 150 limit, with the closed positions it becomes an issue…
Hi, I just uploaded a new version which supports up to 250 stock tickers!
Hi All,
This is just an amazing tool to track investments. Thank you for making this available!
I just had a quick query and maybe it is not possible. I purchase a lot of USD in GBP and the exchange rate plays a huge amount in any returns. Is there a way to input this (for example type all the exchange rates per transaction) and then have the total gains/loss shown
Hi Ashley,
If you’d like the track your returns while holding foreign currency, you could try this workaround (I haven’t tested it out myself, but it should work):
– On the “Setup” tab, add a new stock ticker called $GBPUSD (or something else that doesn’t return a market value on google finance)
– Whenever you use your GBP to buy USD, enter a BUY transaction on the new ticker reflecting the current exchange rate / total amount
– When you use your USD to buy stocks, enter a SELL transaction on the new ticker
This method will allow you to track the performance of your currency trades.
Brookfield Energy Partners (TSE:BEP.UN) did a strange split recently so some of my BEP.UN cost basis changed and I received some BEPC shares. Does anyone know how to record what they did properly into this spreadsheet? I assume I shouldn’t record BEPC as a BUY since they just gave it to me. And what’s the best way to change the cost of BEP.UN since it got adjusted?
I’d love to see an answer for this as well.
Details of the “effective stock split” can be found here: https://bep.brookfield.com/~/media/Files/B/Brookfield-BEP-IR-V2/events-and-presentations/2020-bepc-presentation-april-2020-vf.pdf
Also, since fractional shares were not issued, it would be nice to know how to record the cash payout on the difference.
Thank you so much for sharing!! I have been looking for one like this for weeks now.
One question, is it possible for me to change the standard date format from MM-DD-YYYY to DD-MM-YYYY?
Thanks!
James
Hi James,
You can change the date formats by following this guide:
https://support.google.com/docs/answer/56470?co=GENIE.Platform%3DDesktop&hl=en
See the section about customizing a date / custom formats. The current format used in the file is MM-DD-YYYY. If you edit the custom formatting, you can change it instead to DD-MM-YYYY.
You’d need to make this change wherever date inputs are needed (e.g., the date column of the Trade Log tab).
I hope this helps!
Hello there,
Your work is amazing. I started to build my Gsheets for my portfolio but why reinvent the wheel? Your document is above expectation.
I have few questions:
1) Is there a way ton include Stock options in the portfolio? I think Google finance is not able to quote Stock options.
2) How can I see individual stock performance (Capital gain + Dividend over a period)?
Congratulation again, I will definetely buy you a coffee!
T
Hi Thierry,
This tool was built with fairly ‘vanilla’ investors in mind (buying and holding individual stocks or ETFs), so unfortunately it does not handle derivatives well.
I haven’t tested it out, but I think that this solution may work:
– Add a new ticker symbol (e.g., AAPL.CALL if you are selling calls on Apple)
– When you sell a call, add a sell transaction on the AAPL.CALL ticker (reflecting the premium received)
– When the call is exercised or expires, enter a buy transaction on AAPL.CALL at the price at which you pay out ($0 if the option expires)
Please note that google finance will not be able to automatically pull the market prices while the trade is open.
For your second question, there isn’t currently a single output that lets you see total performance for each stock. However, the data is split between the:
– “Your Portfolio Holdings” tab, which shows the unrealized gains and dividends received for each stock in your portfolio
– “Realized Gains” tab, which shows the realized gains of your overall portfolio / investment categories / individual stocks
Any coffee would be greatly appreciated, thank you for the offer
Hi this is a very good sheet but i did not see any support crypto currencies. Google finance does not have symbol and price information. They are all either on coinmarketcap.com or coingecko.com. Is it possible to add support for crypto currencies as those are the rage now a days
Hi Khasim,
The spreadsheet doesn’t support crypto currencies today (or any other assets not tracked on google finance).
However, perhaps this could be added in a future version.
You might be able to find a ticker that does track closely – for bitcoin I found INDEXNASDAQ:BLX which seems to track pretty closely. It is not exact, but close enough for me.
That’s a great workaround — thanks for suggesting it Julie!
Hello,
Love the portfolio tracker you built! I will definitely be tipping!
Im new and just recently entered in my trade log a couple days ago and I just had one question:
When I choose a starting date prior to having made any trades yet in my portfolio (so my starting value is 0) the contributions (cell D76) does match my cost base in the “Your Portfolio Holdings” tab (cell U8). I was just wondering the reason for this or if maybe I have a glitch.
Thanks again!
Hello,
Thank you for sharing this incredible worksheet. I am a beginner and I have a few managed funds in my portfolio. How do I log the year end distributions that I get from these funds ? My funds issue these distributions and they are reinvested.
Thanks for your help.
Hi Sathesh,
It sounds like you are getting dividends at the end of the year, and that those dividends are automatically reinvested to purchased more shares of the fund.
To record dividends that are reinvested into new shares:
– Enter these as two separate transactions. One transaction is the regular “dividend” transaction, and the second transaction is a “buy” transaction to record the purchase of additional shares
– For example, let’s say you get a dividend of $20 which was reinvested into 4 new shares of XYZ (implied price of $5 per share). You’d enter two transactions: a “dividend” transaction where you receive $20 total, and a separate “buy” transaction where you buy 4 new shares for $5 per share
– The tracker will now record that this dividend has been reinvested to purchase additional shares of XYZ
Hello,
Thanks for your reply. In the Trade Log,in wath cirucmstances should i use the “Return of Capital” and “Reinvested Capital Gain Distribution”.
Thanks
Sathesh
Hi Sathesh,
See here for definitions of “return of capital” and “reinvested capital gain distribution” transaction:
https://www.investopedia.com/terms/r/returnofcapital.asp
https://www.investopedia.com/terms/c/capitalgainsdistribution.asp
Your account / brokerage statements (which are typically available every month or quarter) should indicate when one of these transactions occurs.
Hi Christian,
Thanks for your comment and your kind offer to tip for the spreadsheet.
On the Dashboard tab, the contributions amount is calculated as the sum of all BUY transactions during the date range that you’ve inputted.
On the Your Portfolio Holdings tab, the total cost base amount is the cost base of all of the investments currently in your portfolio.
These numbers won’t be exactly the same if you’ve done some trading in and out of stocks during the time period.
For example, let’s say that you make the following trades:
– Buy $100 of AAPL
– Sell $110 of AAPL
– Buy $110 of TSLA
The contributions cell (sum of all buys) would show $210, while your total cost base would be $110.
Basically, the two values are similar but aren’t meant to show exactly the same thing.
I hope this helps!
Thank you for your response! I will be buying you a “couple coffees.”
One suggestion I had was to add a Daily Gain section in the dashboard. Just an idea!
Again thanks a lot for the great spreadsheet!
Hi there!
This is a great tool! Thank you so much for developing it!
I did have one question. If you undergo a journaling (IE: converting your shares from the TSX to the NYSE or vice-versa), how would you mark that? Is there a way to do it? or do you just update the stock price that you purchased at?
Thanks!
Hi Dylan,
I haven’t tested this out myself, but I think that you enter two transactions on the trade log — a sell transaction and corresponding buy transaction.
For example, sell $200CAD of the TSX ticker, buy $150USD of the NYSE ticker on the same day.
This way, the tracker will reflect you owning the TSX ticker beforehand, and the NYSE ticker afterwards. There would be no net gain or loss taking place on the date of the journaling.
I hope this helps.
I use rbc online banking, wealthsimple, and questrade for my investments. Is there anyway to track investments by service or atleast capture it?
Hi Ahmed,
On the Setup tab of the spreadsheet, you can enter custom labels for “Investment Accounts”. So for example, you could set up labels for “RBC”, “Wealthsimple”, and “Questrade”.
Then, the Dashboard tab of the spreadsheet will show the breakdown of your total portfolio value between these different accounts.
Can you elaborate on how to enter data for a stock split? Thank you
How can I enter short positions in the trade log?
Hi Bruno,
This tool was built with fairly ‘vanilla’ investors in mind (buying and holding individual stocks or ETFs — long positions only), so unfortunately it does not handle short sales well.
I haven’t tested it out, but I think that this workaround may help:
– On the date that you initiate the short position, enter a sell transaction (e.g., sell 100 shares of XYZ for $5 per share)
– Immediately enter a second buy transaction on the trade log, buying back those shares at the current market price (e.g., buy 100 shares of XYZ for $5 per share)
– Once you close the short trade, adjust the buy back price to reflect the actual price at which you closed out the trade (e.g., buy back 100 shares at $4.50 per share, thereby creating a gain of $0.50 per share / $50 in total)
This will allow you to reflect short trades in your realized gains and overall portfolio performance metrics.
I hope this helps!
Thank you for your response! I will be buying you a “couple coffees.”
One suggestion I had was to add a Daily Gain section in the dashboard. Just an idea!
Again thanks a lot for the great spreadsheet!
Thank you so much for the coffees Christian — it is appreciated! Will help to me to continue improving this spreadsheet.
Also, thanks for your suggestion. I’ll keep that “daily gain” output in mind for future releases of the sheet.
Cheers!
Is there a way to change the starting date in the monthly performance? It’s pulling from 2015 and throwing some phantom numbers in (ie. I only entered 2020 trades as a test in the trade log tab)
Hi W,
I think that something might be broken in your copy of the spreadsheet. The Monthly Performance tab should start at the first month that you’ve inputted trades.
i.e., since you’ve only inputted trades in 2020, that tab should start in 2020.
Can you try a “spreadsheet refresh”, as discussed in the Frequently Asked Questions section — question #5?
Also, please make sure that you’re inputting dates in the correct format, which is MM-DD-YYYY.
Thank you for the reply.
Upon further inspection of each trade, I found a typo where one had a year of 2015.
I might be asking a really obvious question but is there any way to sort the output information?
Right clicking a column -> Sort by A-Z seems to work fine for the Trade Log sheet but I can’t seem to do the same with the Portfolio Holdings sheet, as soon as I try sorting a column all the data become mismatched. I’m guessing this is a Google Sheet limitation.
By the way awesome work with the template! Thank you from Taiwan!!
Hi Yen,
Yes unfortunately this is an issue with Google Sheets — since the “Your Portfolio Holdings” tab uses lookup formulas to pull the info dynamically for each ticker, performing a sort function will ‘mismatch’ the data as you saw.
If you wanted to do a one-off analysis, you could copy then “paste as values” the info from that tab into a newly created tab, and then do any sorting that you want. Pasting as values would mean that the info would remain static — i.e., a point in time analysis rather than a dynamically updating analysis.
I hope this helps!
P.S., I hope to make it to Taiwan one day — I was supposed to visit Taipei in February, but those plans were dashed due to the pandemic
Awesome work – you are a life saver!!
Few observations/suggestions:
1) On the Monthly Performance tab, cell U3 of that tab, the formula was giving error as I had “na” on cell T3. Changed it to =Iferror((1+T3), 1) and it worked.
2) On the Monthly Performance tab, the one time approval to allow the script wasnt that straightforward as my google account was blocking it stating that it was not from a Google trusted source. Since these spreadsheets have personal finance data, would be helpful to address that with Google so that people feel at ease. Thoughts?
3) Any other ideas of how this could be used for better portfolio management (Sharpe ratio, risk profile etc.)?
4) I have 10 years of data on this file and it reads a couple of times to cycle through all the data. Any other ideas how we can speed this up a bit?
Thanks Sal for the comments & feedback!
I’ve implemented the change in comment #1.
For #2, it would definitely be better if the script authorization wasn’t needed. I think I’d need to have the script approved by Google to remove that requirement. Will look into it to see if that’s possible.
For #3 and #4, I’ll think more about that! Earlier on I’d tried a few different things to speed up the script, but couldn’t make much progress there.
The issue is that the script needs to cycle through each month and pull market prices from google finance for each ticker. Grabbing this data from google finance runs quite slowly.
Hi, it seems that on the holdings page the data under Market Value (from Google) is formatted improperly. An equity that should be 21.99 is showing up as 0.21. The trade log information is accurate though. Any idea why this is happening? I have refreshed and even redid it but no change.
Hi Mike,
On the Setup tab, have you inputted “Y” beside that ticker in column G? That would cause the market value to be divided by 100.
Another idea — can you please try a spreadsheet refresh, as detailed in the Frequently Asked Questions section of this page, question #5? That will fix any issues that might have been caused by accidentally deleting formulas in the sheet.
If you still have issues, feel free to share your spreadsheet with me by email, and I can try to troubleshoot.
Wow. I am an idiot. When I did setup I thought that just meant does the quote price include cents as opposed to rounding to the nearest dollar. That worked. Thank you
Awesome sheet my friend!! Kudos..however a few things that need to added to make it very usable and robust, IMHO
1. accounting for Cash in all accounts
2. Ability to make more than 10 accounts (Due to 401Ks IRAs etc. and test accounts like Robinhood etc.)
3. Most importantly, ability to lock cells in trade logs tab- so they cannot be changed once entered….perhaps only allowed with a password.
4. The Ticker setup tabs should automatically drop things that are not in holding…so if AAPL was bought and sold off it doesnt need to pull that info for current pricing.
5. Finally, and this address some of ur previous commentators..maybe some way to copy this sheet on a say 3 year basis – so create copies for large data sets like 2013-2016 etc…the only issue is you’ll prolly loose the comparison abilty and how to bring carry forward position (cost basis etc) for those long held.
Hi…excellent the portifolio. Really amazing.
How do you calcult the “Portfolio Starting Value” on Monthly Perfromance. I dont know why, but I have for one month a peak very high and 1 year latter a fall very lower.
I checked the split, tha values and etc….
Have you any clue for this problem?
Hi Melo,
The Portfolio Starting Value is calculated by looking at how many shares you held of each ticker on that day / the price of each of those tickers on that day as well. The values are multiplied and summed up to arrive at a total value.
You can see that calculation being done at the far-right of the “Your Portfolio Holdings” tab.
Can you please try a spreadsheet refresh — as detailed in the Frequently Asked Questions section of this page, question #5? That will fix any issues that might have been caused by accidentally deleting formulas in the sheet.
If you still have issues, feel free to share your spreadsheet with me by email, and I can try to troubleshoot.
The Tracker is amazing, with tons of functions!
I really appreciate the effort you put into this Tools
I get 2Q when using it.
1. At the monthly Performance Tab, when I hit the “Go” button and proceed on authorization. After I choose my gmail account. It returns “Sign in with Google temporarily disabled for this app”. May I know how to get around it?
2. When I sell the stocks, and not reinvest into other stocks, it seems the tracker will count it as loss in “investment returns” in the Dashboard Tab, “Performance of your total portfolio. It is expected ?
Hi YH,
For question #1, that is very strange — I haven’t seen that issue before. Usually you just need to select your email account, and then click “Allow”. I just re-tested it on my personal version of the spreadsheet and it worked fine.
I’m not sure what the issue could be. Could you try a different browser? Also, perhaps if you sign out from your gmail account and sign back in, it might help?
For question #2, when you sell stocks, those should be counted as “Withdrawals” on the Dashboard tab (not as negative investment returns). The contributions figure is the sum of all BUYs, and the withdrawals is the sum of all SELLs.
Can you please try a spreadsheet refresh — as detailed in the Frequently Asked Questions section of this page, question #5? That will fix any issues that might have been caused by accidentally deleting formulas in the sheet.
If you still have issues, feel free to share your spreadsheet with me by email, and I can try to troubleshoot.
Any chance of adding different returns comparisons to the Monthly Performance tab?
For example, I felt really bad underperforming the S&P 500 with mostly Canadian stocks until I realized I was outperforming the TSX.
I don’t know how difficult to implement this would be but if adding a custom comparison is too difficult, perhaps just adding the TSX as well might be useful to the Canadian users.
Hi Moka,
Yes this is on the roadmap for future versions! Ideally, I’d like to have the option to select various stock and bond indices and also mixes of stock/bond allocation (e.g., benchmarking your portfolio performance against an 80/20 mix).
What accounting method does Investment Portfolio Tracker use to calculate realized gains? FIFO or Average Cost Balance (ACB) or some other method? Many thanks!
Hi Richard,
The spreadsheet uses the Adjusted Cost Base (ACB) method to calculate realized gains.
Thanks!
Hi, thank you so much for this very useful tool. Is it possible to change the monthly performance tracker to weekly or daily?
Hi Jim,
It’s possible, but would require quite a few edits on the Monthly Performance tab, and also the script that runs on that tab.
I decided to do it on a monthly basis by default since the script runs rather slowly, so a more granular time period would be quite cumbersome.
Hi there! Thank you so much for this tool It’s really awesome!
I was wondering, is there a way that we can compare just the overall % monthly returns of our holdings, benchmarked to SPY? Like a monthly CAGR/TWR% graph. That would be so awesome. Thank you for the work you are doing!!
Hi Bjorn,
Check out the Monthly Performance tab! The data on the right shows the monthly performance for your portfolio and for the S&P500. Then on the left side of the tab there’s a chart comparing the two.
Thank you!! Just wondering, I only see Portfolio Performance vs S&P 500 (Indexed). It would be great if there could be some sort of % view! Like SPY Money weighted % vs portfolio money weighted % Not sure what does indexed means haha. Thanks alot!
Hey great spreadsheet. Say my platform does not allow for DRIPs and i have to manually invest my dividends, also I cannot buy partial units, so say it takes 3 months for me to be able to reinvest my dividends to buy the same stock. How would I index this?
Hi Benjamin,
Please see the frequently asked questions section of this page.
When you receive a dividend, just enter a dividend transaction reflecting the total $ amount received. Then, whenever you use the dividends to buy new shares, enter a buy transaction on that date.
For example:
– Jan. 1 — dividend of $20
– Feb. 1 — dividend of $20
– Mar. 1 — dividend of $20
– Mar. 1 — buy 1 share for $60
Thank you for this amazing tool! You are a scholar and a gentleman my friend. thank you so much!
If you don’t mind I’d like to put in a request for real-time crypto prices
Hi James,
Please see Julie’s earlier comment for a clever workaround for crypto prices.
“You might be able to find a ticker that does track closely – for bitcoin I found INDEXNASDAQ:BLX which seems to track pretty closely. It is not exact, but close enough for me.”
Looks really exciting what you have made in google sheet, I guess you have not also made it in apple numbers ?.
Hi Kasper,
Unfortunately not — this spreadsheet is only available in google sheets for now.
Hi there. Love the new Monthly performance tab.
I have an enhancement suggestion.
Often times when entering trade info I would like to insert a new row to add a trade in between or re-order my trades based on date or some thing of the sort.
Currently doing so will mess things up since the data entry rows are shared with some calculation rows.
I have created a version: https://docs.google.com/spreadsheets/d/1ieAsZdXuJyjDhMEWwK-AJaSMZTAOHQhsEuhumuGDo8A/edit?usp=sharing
Where I split the Data Entry and the calculation into separate sheets. A new “Trade Log Entry” sheet has been added for the user to enter the info into and the existing “Trade Log” tab just takes the info from there using ARRAY_FORMULA. It could instead refer to the “Trade Log Entry” sheet, but this was a quicker way to implement the change.
Let me know what you think. Would love it if you would incorporate these changes in the official version
Thanks,
Jason
Hi Jason,
Great suggestion. I’ve just implemented the change in version 8.1 of the spreadsheet.
You should now be able to add new rows / delete rows / sort on the Trade Log tab, without breaking the calculations.
The underlying calculations have been moved to a new tab — “Calc Trade Log”, with =ARRAYFORMULA used to link back to the Trade Log (input) tab.
Cheers!
Awesome! Will upgrade soon
Thanks a lot!
Hello
Great spreadsheet !!
i just have 1 question, How do i copy the 2 tabs, from my existing sheet, to the new updatet sheet ? If i copy to existing sheet, it will only enter as a copy of xx :/
Friendly regards / Mark
Hi Mark,
You just need to copy the values on your old tab, and then paste them into the new tab.
Don’t copy the entire tab, just copy the values (Ctrl+C / Ctrl+V).
I hope this helps!
Thank you for making this! It’s truly awesome! I’m wondering if one could use this to track adjusted cost base for tax purposes? Would it give the same information as using adjustedcostbase.ca?
Hi Jamie,
I’ve never used adjustedcostbase.ca so I can’t say for sure — however, this tool should be OK to use for tax purposes.
Just make sure to double check your inputs on the trade log, and use the “account filter” menu at the top of Dashboard tab to focus on the relevant account. By default, the spreadsheet will show your average cost base across all accounts. In Canada, TFSA / RRSP accounts are tax free, so they should be excluded from cost base calculations.
Hello,
I love this workbook and have been using it since V5. Thank you for all your hard work it keeping this workbook up to date. It has improved immensely with each new version.
My only suggestion for an improvement is to allow for your Target Asset allocations on the Re-balancing sheet to change when you filter for a particular account. Currently I keep a separate TFSA and RRSP workbook where I use the re-balancing sheet to rebalance my individual accounts and I keep a combined workbook to get an overall picture of both accounts together.
Hi Steven,
Thanks for keeping up with the new versions!
I’ll make note of your suggestion — hopefully I can add in a future version.
Cheers.
I absolutely love the program you made, It works really well.
 .
.
Inside the “Trade Log” sheet. how does it pick up the Currency when buying and selling, because I think I get some other numbers in the sheet. “Realized gains” ?.
Some suggestions or ideas. .
.
1. A way to search for Your shares in index (eg Spx500, dax or omx25dk.) Or in currency (eg USD, EUR or DKK.)
2. A tab under “Trade Log” where you can write Exchange rates that a Broker has used ?.
Hi,
Thanks for creating this sheet. It really helpful and I have been using it since version 5.4.
Do you have any plan to add a way to calculate Portfolio Dividend Yield and Dividend Growth Rate.
And possibly a chart to show future growth?
Thanks again for all your work.
Hi Danny,
In the bottom table of the “Dividends” tab, you can find some info about the dividend yield of your investments.
Unfortunately, I can’t find a reliable way to automatically import dividend or dividend growth info into the spreadsheet for any given ticker.
Hey TMOAP,
Thank you for making this portfolio tracker.
Instead of investing in ETFs, I do direct indexing (see https://money.usnews.com/investing/investing-101/articles/what-is-direct-indexing).
It would be really awesome if you could have the Rebalancing sheet support individual stocks and not just ETFs. The number of stocks is around ~60-70.
how do i change the divend dates mine is about 5 years behind and the months is about 2 years behind, can i change it or does it change auto ??
Hi, the annual dividend output will always show the previous 5 years, and the monthly output will show the previous 24 months.
These periods will automatically adjust as time goes on.
How would I update a stock to reflect a stock split of 1:25
To enter a split transaction, you need to input the following information on the trade log:
– Date when the split occurred — in column B
– Transaction type of SPLIT — in column C
– Stock ticker — in column D
– Split Ratio (new shares per old share) — in column J
You can leave columns E through I empty.
I hope this helps!
Yes, it did. Thank you sir.
Upon doing the stock split. its giving incorrect quantities. for instant: TTNP did a stock split of 1:30 and I put that in and it gave a higher number than the 3 shares I would of gotten from my 100 original shares
Hi Marcus,
For the split ratio, did you input =1/30 in the split ratio column? This will convert 30 old shares into 1 new share.
Could you try a spreadsheet refresh, as detailed in the Frequently Asked Questions section of this page — question 5?
If the issue is still there afterwards, can you share your spreadsheet with me by email? If so, I can take a look and troubleshoot.
So to verify, I need to input =1/30 and not 1:30?
So the verify, I input =1/30 and not 1:30. that could be my issue regarding inaccuracies.
Hi Marcus, yes that’s correct. You should input =1/30 for the split ratio column.
I’m running into a couple of issues since upgrading from version 6.? to version 8.
1. The changes that were made to the money weighted rate of return for less than a year intuitively seem to be off. For example. In one year I have an account balance that fluctuates from 20-35K. I made 5k in investment gains. The yearly return shows 22% but as soon as I go just shorter than a year (by a matter of days), 10% shows up.
2. In the monthly returns, the money weighted return seems stuck on 4.4%. I got a new version of the worksheet but there isn’t a formula in that spot, just a zero.
Thanks for any insight you can provide. I love the sheet!
Hi Matt,
For question #1, could you share your spreadsheet with me by email with a description of what you’re looking at? I’d like to take a look to see if there’s an issue.
For question #2, could you let me know which cells or columns you’re looking at? Also, could you try a spreadsheet refresh (as mentioned in question #5 in the Frequently Asked Questions section on this page)?
Thanks for the great spreadsheet, just what I was looking for! A nice to have update would be a second set of categories for industry sectors.
Hi Mike,
I’ll try to think of an elegant solution to allow for industry sectors to be inputted, and try to add it in a future version.
I’m always looking to balance adding new features and functionality against making the spreadsheet too unwieldy, given that some users don’t want to be forced to input lots of detail when they are setting up the sheet.
Hi,
Over the years including closed positions, I am above 150 stocks.
Could you please let me know if there is a way I can increase the number of stocks to more than 150, I can’t find that option?
Thanks
Hi Valjean,
Unfortunately you can’t add more than 150 stock tickers without making edits to formulas on a few tabs throughout the spreadsheet.
I might increase the limit in a future version, but I want to make sure that it doesn’t slow down the spreadsheet too much. The spreadsheet is already quite “heavy” as it is, so I want to avoid creating more lag in the calculations.
ok, I will try to split my portfolio in the meantime then.
Thanks
Hi, I just uploaded a new version which supports up to 250 stock tickers!
I second this. Increasing to 300 would be great.
Hey thanks again for continuingly update this excellent spreadsheet. My inquirie is about there seems to be a bug, at least on my end in calculating The ”Cost Base” for one of my shares that I can buy fractionally (through an employer purchase plan). It calculates the number of units I have without a problem, but the ”Cost Base” on the holdings page is set at 0, which at the end of the day messes up my total portfolio gain as I am 550% up when I should realistically be 20% up or so. I don’t seem to have this problem with whole shares, just this one fractionally bought share in particular.
Hi Benjamin,
The spreadsheet should handle fractional shares OK. Perhaps some formulas got deleted or changed accidentally in your copy — could you try with a fresh copy of the spreadsheet? See the Frequently Asked Questions section of this page, question #5.
Hi,
I am new to your DIY google sheets. I looks awesome and I am thinking of of trying to copy my investment data to the tool. However, I do have investments in more different currencies than seem to be supported by the tool. Is it possible to have the number of currencies expanded to 12-15? May I just enter more rows to the respective tab?
Thx
Hi Bernhard,
To add more currency options, you’d need to make modifications to formulas on a few of the tabs. It’s currently set at 5 currencies max.
Hi there,
This is an amazing spreadsheet! Thank you.
Feature requests per subsheet:
– *Setup*: Allow Portfolio Holdings upto 300
– *Trade Log*: Increase to 10k
– *Your Portfolio Holdings*: Allow up to 300
– *Realized Gains:* Show all 300 portfolio holdings
– *Dividends*: Show all 300 portfolio holdings
Hi, I just uploaded a new version which supports up to 250 stock tickers!
hi there,
your spreadsheet is awesome! And May I ask why at Realized Gain Page that Realized Gain% not include dividends after stock sold? I think it is more accuracy to show stock performacne. how do you think
thanks
Frank
Hi Frank,
The term “realized gains” is defined as the price that you sell at, minus the cost base of the investment. Dividends don’t factor into this calculation.
https://www.investopedia.com/terms/r/realizedprofit.asp
People might use this spreadsheet for tax purposes for calculating their capital gains, so I don’t want to mess with the proper way to calculate this!
However, it would definitely be useful to see the return when you also factor in dividends.
I’ll try to add some new columns in a future version — labelled “Realized Gains + Dividends”, or something like that.
Thanks for your comment!
Just stumbled on your tools on this site and copied them to my google account. I’m so excited to start using them. After look through this investment tracker I am wondering it you have given thought tracking crypto investments with this or a similar tool. I feel like I will try modifying this tool support that once I get my hands dirty. Also do you have anything in the works for Real Estate investments and tracking income property?
So far I am really liking the simplity and power of your financial tools! keep up the great work!
-Taylor
Hi Taylor,
Glad that you like the sheet! This spreadsheet can automatically track the price of anything that appears on google finance. If you look through some of the older comments here, a user mentioned tracking their bitcoin investments using a stock market traded ticker as a proxy. It’s a clever solution that should work well.
For tracking real estate investments, you could do that by setting it up as a new ticker (e.g., $HOUSE), and then manually inputting the market value.
Hi,
Many thanks for the sheet.
Is there a way to input date in dd-mm-yyyy same a UK?
Thanks
Hi Morteza,
You can change the date formats by following this guide:
https://support.google.com/docs/answer/56470?co=GENIE.Platform%3DDesktop&hl=en
See the section about customizing a date / custom formats. The current format used in the file is MM-DD-YYYY. If you edit the custom formatting, you can change it instead to DD-MM-YYYY.
You’d need to make this change in the date column of Trade Log tab.
I hope this helps!
Hi again,
For GBP (UK) they use pennies on all their stocks, ETF, etc., can you fix the sheet please?
eg: OCDO price 2247 is 2247p=£22.47
Many Thanks
Please see the Setup tab. In the section where you input your tickers, there is a column where you can tell the spreadsheet if the price is shown in pence (rather than pounds).
Once you fill that out, the spreadsheet will adjust accordingly.
I input our data export from betterment and the income per month is way off. The actual ending balance is within 100 dollars of the betterment balance however when i look at the contribution and income the balance inst correct. It says that in contributions we did like 66K and in investment gains we had -40K which brought us to a correct ending balance of 26K (off by about 100$ total). Any idea what would cause this? Wed love to use it but it seems the only thing close to accurate with our data is the ending balance. Not sure what we entered wrong from betterment. The sum of our total cost bases says its like 66K which seems way off considering the end balance of the acc is like 26K
Hi,
This spreadsheet is really a “garbage in, garbage out” type of tool.
Please review the “Your Portfolio Holdings” tab and go row-by-row through your holdings. Is the number of shares for each ticker held correct? What about the cost base for each ticker?
If you find some inconsistencies with what you’d expect, then go through the Trade Log tab and see if you can spot any entries that are causing the error.
Sorry I can’t be of much more help. Also please read through this page, including the Frequently Asked Questions (FAQ) section. You can also try a spreadsheet refresh as mention in the FAQ, question #5.
Thanks for the insight. Ill review it – I copied and pasted direct from betterments CSV but i totally get garbage in garbage out. Overall very dissatisfied at betterments data output system. Thanks for the quick response!
FIGURED IT OUT! Betterments cost basis was the # shares * price per share = total cost basis so when i copied it over i copied the total cost basis instead of the price per share (which betterment didnt list). I backed out the price per share and plugged it in and it worked perfectly. Thanks so so so much!
You’re welcome, happy to hear that you sorted it out! In most cases these issues are caused by small errors or inconsistencies in the data input.
Cheers
Have you sold and bought the same stocks before the 30 days cool-off period? that which would make your cost basis higher on your brokerage end for which this spreadsheet can’t account for and only calculate what the cost basis should be. mines is off as well but that is my reason. if the cost basis is off then that throws off your totals. this is my assumption. if that isn’t it, ooh.
I dont believe so but am not clear bc betterment does robo investing so I dont have a great deal of insight into it beyond rebalancing which i believe is the only time things get sold – out realized gain/loss is tiny like ($11) so that makes me think there isnt a lot of selling going on
Hi Marcus, the spreadsheet doesn’t make any special calculations if you buy and sell a stock within 30 days.
It will always be the same calculation regardless of the timing of when you buy and sell.
Just stumbled on to this tool and it looks like it might be exactly what I’m looking for. One question that I didn’t see an answer for: to start using this tool when one has existing investments, do I just enter a “buy” on a date I have a value for that investment and track from that point onward, or is there a special provision to enter an initial balance? Sorry if this was answered somewhere and I didn’t see it and thanks for your work!
Hi Joel,
If possible, it’s best to record your full history of trades — the dates that you bought each of your existing investments, and the price at which you bought them. That will provide the most accurate calculations for things like historical performance and realized gains.
However, if you don’t have the full data to do this, for each of your holdings you can just enter buy transactions using today’s date, at today’s price. This will allow you to do performance reporting from today onwards (but won’t allow you to look back in time before today).
I hope this helps!
For below code, I think ‘Monthly Performance!D120’ need to change to ‘D141’
————————————
//grab money-weighted return for the full date range
var totalDateRange = ss.getRange(‘Monthly Performance!G26:G27’).getValues();
ss.getRange(‘Dashboard!C53:C54’).setValues(totalDateRange);
SpreadsheetApp.flush();
ss.getRange(‘Dashboard!I76’).copyTo(ss.getRange(“Monthly Performance!D120”), {contentsOnly: true});
———————
Anyway, I appreciate your constant update on the sheet. Have a good day
You’re right, thanks very much Chris! I just fixed it.
In the last update I put in a few more rows on that tab to add a new graph comparing monthly returns of your portfolio vs the S&P500 — and forgot to update that cell reference in the code.
Cheers and thanks again for your sharp eye!
Hi Marcus
If you have multiple buys on the same stock over the course of several months, does the program automatically calculate the average cost or does it treat them as separate buys?
Thanks. Great tool!
If you have multiple buys on the same stock over the course of several months, does the program automatically calculate the average cost or does it treat them as separate buys?
Thanks. Great tool!
The spreadsheet will automatically calculate the average cost base across all of your buy transactions.
This works across investment accounts as well — i.e., the Your Portfolio Holdings tab will show the average cost base across all buy transactions and all accounts.
However, at the top of the dashboard tab, you can always filter on only one investment account at a time. In that case, the average cost base for that account only will be shown.
I hope this helps!
I’ve enjoyed your worksheet. I found it from a Rob Carrick tweet. I’ve been trying to figure out how to trick it into letting me enter cash and mutual funds.
In the ‘Your Portfolio Holdings’ tab, does Column G formula contain an error (a misplaced “/100″ ) ?
=if($B30=””,””,iferror(if($AU30=”Y”,vlookup(Calculations!$C$2242+16/24,googlefinance($B30, “close”, (Calculations!$C$2242+16/24)-7, 7),2,true)
/100
,vlookup(Calculations!$C$2242+16/24,googlefinance($B30, “close”, (Calculations!$C$2242+16/24)-7, 7),2,true)),0))
Thanks
Glen
Hi Glen,
Thanks for your comment.
Please read through the frequently asked questions section of this page. There’s a guide to tracking cash positions there. You can also finds some tips about manual price entry for mutual funds.
I think the existing formula works OK. The reason for that divide by 100 is that some stocks (mostly in the UK) quote their price in cents rather than dollars (pence rather than pounds). So, that formula will divide by 100 to yield the correct units.
The formula is wrapped in an IF formula, so it won’t divide by 100 for “normal” stocks that are quoted in dollars.
I hope this helps!
I see the reason now. I didnt understand the rationale for it. I will switch my SETUP and toggle all of my stocks (all TSE:canadian) back to “N’ for no. That should keep the IF statement from dividing by 100 when it didnt need to as the Canadian stocks are quoted in dollars.
Great sheet. I wish I had better records of my past 10 yrs of purchases. For now I have simply defaulted the TRADELOG so that all of my holdings reflect a purchase date and trade amount of Dec 1 2020.
Glen
Ah yes that would do it! That column is mostly useful for UK stocks which are often quoted in pence rather than pounds (e.g., 526 pence rather than 5.26 pounds).
I’ll try to make that column header title a little more intuitive.
And yes, I had to take some shortcuts when starting my personal portfolio tracking as well. Although now it’s great to have everything neat and tidy in one place.
I seem to be having a problem with the Split ratio. I started with a fresh version of 8.2 and I only put 49 transaction in (my oldest trades of apple) I entered the split of 7/1 and it’s telling me I should have 94,554 shares. (I wish). Looking at the calc trade log tab the number on the Split ration line is 44013.0
Does that mean anything?
Hi Jim,
To enter a split transaction, you need to input the following information on the trade log:
– Date when the split occurred — in column B
– Transaction type of SPLIT — in column C
– Stock ticker — in column D
– Split Ratio (new shares per old share) — in column J
You can leave columns E through I empty.
For your split transaction, you can just enter a value of 7 in column J.
Then, if had previously inputted a buy transaction for 49 shares, the spreadsheet will now yield total holdings of 343 shares (49 x 7).
Also, just to clarify, your BUY transaction and SPLIT transaction should be shown on separate rows.
I hope this helps!
Hi Jim,
I also just added a new item to the Frequently Asked Questions section of this page — please see item 9 for more detail about stock splits.
Thank you for my own section of the FAQ.
I think I have a legitimate question regarding stock splits. I have Apple shares in two accounts. I pulled all these transactions into one copy of your spreadsheet with nothing else.
If I enter one split for one acct it only calculates the new shares for that one acct and doesn’t calculate for the other. When I add a second line for the second account it double calculates the split.
I either end up with 128 shares or 454 but not 157.
Let me know if you’d like me to share this with you privately to see the issue. and THANK YOU
Hi Jim,
Yes please share your spreadsheet with me by email, and I’ll take a look to troubleshoot.
You should only enter a single row for a split — it should split the shares in all accounts at the same time.
Finally got six years of trades entered and the amount of information/insights you provide is amazing. It took me some time to get everything copied over from my old spreadsheet and get things cleaned up.
Two things –
Suggestion: Add a line to the FAQ for clarification that Splits don’t need an account and only need to be entered once.
Request: My old spreadsheet has a section for Total Dividend Forecast. IE: if I received all dividends in a year what would my total be. Basically a Bar graph or just a cell showing the total of Dividends!J120:JXXX . It could be shown off the the side of Dividends received last 5 years.
Cheers, happy to hear that the sheet is working well for you.
Thanks for the suggestions.
I’ve added the one liner on splits to the FAQ.
I’ll look to add that “total dividend forecast” output in the next version.
Hey there, thanks for the awesome sheet!
I have a question around currency conversion and exchange rates.
Being Canadian, most of the time I’m buying stocks with USD prices from a CAD account. When exporting transactions from my trading account, it shows the USD to CAD exchange rate at the time of each buy and / or sell. I’m not positive that the spreadsheet is accurately capturing what it needs to if I’m not entering the exchange rate applied at the time of each trade, is that true?
Also, my TFSA has a flat fee per transaction that’s always in CAD as well, is it possible to accurately capture that?
Thanks again for this great tool!
Hi Mark,
When you buy a ticker that’s not in your home currency, the spreadsheet will convert it back to your home currency based on the exchange rate given by google finance on that day.
This is an automated process that doesn’t require any user input.
You’re right that if the auto-pulled exchange rate isn’t exactly the same as what your trade was done at, your cost base won’t be calculated with exact precision.
You can see the exchange rates used if you go to the “Calc Trade Log” tab at the back, and look at column AJ. Again, these rates are pulled from google finance.
I just did a few tests for different days and compared the rates versus what the Bank of Canada gives (https://www.bankofcanada.ca/rates/exchange/daily-exchange-rates/). The data given by google finance is either the same or just slightly off (e.g., 1.323 vs 1.322 for the CAD-USD rate).
Any inconsistencies should be quite small. However, If you’d like to manually input your own exchange rates for each trade, you can do that by modifying the column I mentioned previously (column AJ of the Calc Trade Log tab).
Please note that if you make manual updates on that column, you can no longer re-order / cut-and-paste / sort the rows on your Trade Log tab. If you do that, your manually inputted rates will be applied to the wrong rows.
—
For your second question, you can enter that trading fee in the “trading fee” column on the Trade Log tab.
If you’re buying a CAD stock, just enter the fee amount (e.g., $5). If you’re buying a USD stock, you’ll need to enter the fee amount in USD (e.g., USD $3.85, assuming an exchange rate of 1.3 CAD per USD).
—
I hope this helps!
Great, thanks for the quick response!
Hey great spredsheet once again. Quick question, the set-up page is having trouble finding a CAnadian company’s stock when it trades both on the NYSE and TSX. For example i hold both LSPD.TO and BCE.TO, the problem is the setup can only find its NYSE counterparts LSPD and BCE. aven if i list the price in CAD on the set up, when i go to into My Holdings, it will list the US price from Yahoo Finance. When I input BCE.TO or LSPD.TO in the setup, it gives me n/a, anyway to bypass this?
Hi Frank,
Please take a look at the FAQ section of this page — there’s some discussion there about this issue.
This spreadsheet pulls share prices from Google Finance (not Yahoo Finance), so you just need to enter the tickers found on google finance instead.
For example, BCE would be TSE:BCE.
Please note that you need to remove any spaces that are between the exchange symbol and the company ticker.
I hope this helps!
Hi,
Thanks a lot for your work.
I have an annoying issue caused, I think, by a price error from Google Finance.
In august 2016, I had EPA:VK (Vallourec) in portfolio. Its actual value was around 4€ (as shown by Yahoo Finance). But Google Finance shows a price around 167€ at this period!
Monthly Performance tab is showing a completely wrong graph because a 217% portfolio return is calculated.
Do you have advice on how to workaround this bug of Google to have a correct calculation ?
Hi Eric,
Strange that the google finance database is so off!
The following workaround should work:
– Make a new tab in your sheet, and download the share price history for that stock (column for date, and column for closing price) — you can get this data from Yahoo Finance
– On the Your Portfolio Holdings tab, use a VLOOKUP formula in the manual price entry columns to pull the correct price from your share price database — you’ll need to add this formula in columns H, AF, and AL, using the appropriate date reference each time
– In cell H262 of the Your Portfolio Holdings tab, select “Yes”
The net result of all of this is that you’ll have created your own pricing database for the stock, and will be pulling in the correct prices through the VLOOKUP formulas. The last step was to make sure that the spreadsheet always uses the manual price rather than the google finance price.
After you’ve done this, you can delete the data in columns N to T of the Monthly Performance tab, and then re-run the script.
Everything should work after this!
I hope this helps.
Thanks a lot !
Seems clear, I’ll try this.
[…] The Measure of a Plan website has updated its investment portfolio tracker – a spreadsheet for DIY investors. […]
Hi.
Is it necessary to record your dividends if you withdraw them as you receive them?
if yes, do you enter the withdrawal of cash also?
Thanks
Hi Alan,
You will need to record your dividends if you’d like them to be reflected in your portfolio performance metrics.
This spreadsheet wasn’t built to track cash contributions or withdrawals.
However, if you’d like to do so, you can read about the $CASH workaround in the FAQ section of this page.
[…] The Measure of a Plan website has updated its investment portfolio tracker – a spreadsheet for DIY investors. […]
Hi again.
One other question. I received shares of Brookfield (BIPC) as a bonus offshoot of Brookfield (BIP.UN)
Since I didn’t purchase these bonus shares, do I enter just the shares or should I enter the cost on the day I received them?
Thanks again!
I’m not familiar with the details of Brookfield stock and/or this split, but I believe the following transactions should be used:
Transaction #1: BUY transaction on BIPC, reflecting the number of shares you received, and the share price of BIPC on the day you received them.
Transaction #2: Return of capital transaction on BIP.UN, with the total $ amount being equal to the total $ amount in transaction #1.
The rationale being that you received a distribution from BIP.UN, which was then used to buy BIPC shares.
Thanks for the clarification.
If I have a holding that is not found at https://www.google.com/finance how do I enter it?
Hi Joel,
Please look through the troubleshooting tips and FAQ section of this page.
You will likely need to use the manual input columns.
How do I input investments for 7 different investment accounts? I’m looking for a drop down menu on the Portfolio Tab to input each account’s investments but not seeing one.
Hi Scott,
Please read through this page as there are instructions given about how to use this spreadsheet.
In particular, see the sections about the Setup tab and the Trade Log tab.
In which tab do I put in opening balances?
I just added a more detailed explanation in the Trade Log section of this page.
Can you please read through that section, and also the FAQ section?
I’m not quite sure what your question is.
You just need to fill out your Trade Log tab with your trading history — one row for each buy, sell, or dividend transaction.
There isn’t any way to record opening balances other than by recording your trades on the Trade Log tab.
Thanks for your prompt responses. I will give it another go.
Just started working with the sheet. Seems pretty awesome.
I have a lot of transactions over the years from my TD Ameritrade Institutional and Fidelity accounts. Do you know of a good way to import those transactions? There are too many to just manually enter at this point to be feasible.
Hi Mike,
Do your brokerage accounts allow you to export your trading history in spreadsheet or CSV format? If so, you can clean-up and rearrange that data in excel or google sheets before pasting that into the Trade Log tab of this spreadsheet.
If not, the only way to record your full history of trades would be by manual input.
It’s best to record your full history of trades — i.e., the dates that you bought each of your existing investments, and the price at which you bought them. That will provide the most accurate calculations for things like historical performance and realized gains.
However, if you don’t have the full data to do this, for each of your holdings you can just enter buy transactions using today’s date, at today’s price. This will allow you to do performance reporting from today onwards (but won’t allow you to look back in time before today).
For example, rather than recording separate buy transactions on Apple shares over the past several years (5 shares here, 10 shares there, etc…), you can just enter a buy transaction for 100 shares (or however many shares you own today), at today’s price.
I hope this helps!
Hi. Thanks for the reply. I have been able to download total units of each asset in table format from TD and Fidelity for the numerous accounts that I have. I am running into an issue with the TD account.
All the units/share numbers are correctly entered with she ticker symbol but somehow the total value is off by quite a bit. I keep double checking and it looks like everything is in there. Also, the dashboard for that account keeps saying only there are only 8 holding but the pie chart shows all 9 holdings. Weird.
Thanks for your help. Very great tool
TMOAP,
I figured out my problem. I had done the modifications for the $CASH but then decided against it so the price change column was screwing with one particular fund that I had listed after $CASH. I went back and reversed the changes and that fixed it. Thanks.
Good to hear Michael. Cheers and happy investing!
I noticed in an earlier comment you wrote “There’s a guide to tracking cash positions [in the FAQ]. You can also finds some tips about manual price entry for mutual funds”. I did a text search on the word “mutual” and didn’t find anything on this page. Are you suggesting that we treat mutual funds in a similar way to cash whereby we create a symbol for the mutual fund and manually enter its value, or am I looking in the wrong place?
Hi Joel, yes that’s correct.
For any asset that isn’t searchable on google finance, you can use manual price entry instead.
Can I sort the data in the tables on the setup tab, or will that mess anything up? From what I can see the order I enter stuff on the setup tab is the same order I see when I’m selecting data on the trade log tab. Once I get a bunch of entries, particularly portfolio holdings entries, I think it would be easier to locate them if they were in a certain order. I think I could manually do it by making copies of data moving things around, but that seems cumbersome. Would I mess anything up if I did an insert row, or if I select all my data and do a “sort by column”? Does it matter if there are blank row entries as long as at the end of the day, all of my data is in the respective table somewhere? And is it safe to assume the answer for the holdings area of the tab would be the same for any table in the tab?
Hi Joel,
I haven’t tested that, but it’s best to avoid sorting if possible.
Instead, you could copy your values onto a new tab, do the sorting there, and then re-paste onto the Setup tab.
That should work fine.
Anyone else having trouble with column AK populating the market prices in the ‘your portfolio holdings’ tab?
I’m getting red all over. Strange since column G is working, which is also share price from google finance.
Hi W,
I just checked my personal spreadsheet this morning and it is working fine for me.
Two ideas:
– Please check the start date / end date that you’ve entered on the Dashboard, in the performance section. Have you inputted valid dates that are in mm-dd-yyyy format?
– If the above doesn’t fix it, you can try a “spreadsheet refresh” in a new copy of the sheet — see item 5 in the FAQ section of this page
I hope this helps!
Thanks for the reply. I’m not sure what’s happening. Tried a fresh sheet with no luck. v8.1 is still working with no issues so I will just continue with that one for now.
Very strange — I just tested my own personal sheet again (v 8.2) and it is working fine.
Would you be able to share a copy of your spreadsheet with me showing the error? I’d like to take a look and troubleshoot if possible.
Hey, just wanted to give you an update after a whole bunch of testing.
I found the issue:
-in the ‘Dashboard’ tab, it looks like you can no longer set a future end date for the ‘performance of your total portfolio’ section. In previous versions, I always had it set to Dec 31, 2020 and there was no issue. In the latest version, it looks like it has to be set to the current date. Any date in the future causes someone of the market value (from google finance) columns to break.
In a completely different topic (in case others have the same issue), I’ve also noticed the max amount of ‘=importxml’ I can use has decreased to 9 cells. I currently use these for some of my index funds that aren’t found on google finance.
Hey W I noticed an issue with the market value in google finance as well.
In my case the end date is set to =TODAY(). For some reason some ETFs get the previous closing date market value not the current one shown on the Google finance web page.
This did not happen in the previous version of the spreadsheet I tested (5.6).
Also related to your note about the importxml limit, there’s a nice workaround based on another function. Here’s more info if anyone stumbles upon it
https://stackoverflow.com/questions/39014766/to-exceed-the-importxml-limit-on-google-spreadsheet
Let me know if you find any issue with the V8.2 google finance formula
Hi Alex and W,
I made some updates to the google finance calls in version 8.2.
I’ve wrapped the formulas in an IF statement that checks if the user input date is greater than or equal to today, in which case it just grabs the real-time value from google finance.
Can you try a fresh version of v8.2 and see if this fixes the issue?
Cheers and happy holidays!
I’ve replaced the formula for the google finance market value with the updated one and the issue is gone.
Thanks a lot! Happy holidays!
OK great, thanks for confirming! Happy holidays.
Hi W,
I think that this should be fixed now. I wrote my detail in my reply to Alex. Can you use a fresh version of v8.2 and see if this fixes it?
Problem solved, but seem to have a different issue now. I’ve sent you a spreadsheet share and a note.
Thank you for this spreadsheet! I had a question around multi asset ETFs (like VGRO). How would you classify them to help with the rebalancing calculations?
Hi N,
For asset allocation / all-in-one ETFs: unfortunately, there isn’t a great way to categorize these funds in the portfolio tracker. On the Setup tab, you could create a new category to tag these as “Blended” or “All in one” or “Mixed” investments. This would distinguish them against pure equity or fixed income investments.
While the rest of the spreadsheet will function OK for these ETFs, the re-balancing calculations won’t take these all in one investments (and their respective equity / fixed income weightings) into consideration. As it is, those re-balancing calculations would need to be done manually.
In a future version of this spreadsheet, I’ll try to think of a way to allow the user to specify the category weightings within these all in one investments.
Thank you! Makes sense.
Hi! I just discovered your spreadsheet and I’m so excited to use it! However, I think I’ve run into a problem. I am going through the Trade log, and I have some fractional shares that do not equal 1. When I try to add that to the “Quantity of units” field, it tells me that I must enter a number equal or greater than 1. I am not sure how to best proceed.
You can disregard this comment! I found this question in the older comments and figured out what to do! Thank you for your amazing work!
OK great, glad that this is sorted out! Cheers and happy holidays.
What ‘Transaction Type’ should we select for cash deposits in the trade log? I believe that withdrawals are tracked as “Return of capital”
Hi Vee,
Please read through the FAQ section of this page. This spreadsheet is not meant to track cash deposits and cash withdrawals, but you can do so if you’d like by following the $CASH method.
This spreadsheet rocks!
I just received end of year distributions on some funds. It’s the first time that I have had long-term capital gains that were not reinvested. I now have them as cash. So, in the trade log how should I enter these? Of course it won’t be “Reinvested capital gain distribution”. Is it a “sell”?
Hi Scott,
When you say “end of year distributions”, were these dividends? If so, you’d use the “Dividend” transaction type.
If you sold shares, then you should enter a “sell” transaction.
Please read through the FAQ section of this page for more info.
Hi, thanks for asking. I miss-wrote long-term above. It was actually “S/T CAPITAL GAIN RECORD 12/14/20 PAY 12/16/20” which I believe indicates short-term. It is listed as a dollar amount and now sits in my account as cash. It was not reinvested. This is a first for me. All previous fund distributions that were capital gains and/or dividends were reinvested.
I want to enter this correctly because I know that capital gains can change my cost basis
Hi Scott,
It sounds like this is a US mutual fund — as a Canadian investor, I’m a bit out of my depth here, so take what I say with a grain of salt.
Since you received this distribution as cash and it wasn’t reinvested, I think you should just enter it as a dividend transaction. This will have a nil impact on the cost base of your investment.
If this distribution was reinvested, you would use the “reinvested capital gains distribution” transaction type, which would increase the cost base of your holding accordingly.
I hope this helps!
LONG-TERM CAP GAIN as of 12/16/2020 DFA GLOBAL REAL ESTATE SEC PORTFOLIO (DFGEX) (Cash)
On the trade log the above transaction would be logged as “Reinvested capital gains distribution” correct then a corresponding second entry for the BUY of the reinvestment correct?
Thanks again.
Hi Michael,
When you received this distribution, did the reinvestment increase the number of shares that you hold?
If your # of shares stayed the same, you’ll just need to enter the first transaction for “reinvested capital gains distribution”. You don’t need to enter a second BUY transaction.
I hope this helps!
It would be great if this supported partial shares. I’m trying to help my kids get interested in investing, and want to use this to track their investments, which are between $1 – $10 generally. So they are always buying less than 1 share (virtually, I take care of their “gains”). But when I enter in less than 1 share, the dashboard does not work.
Hi Ryan,
That sounds like a fun and educational activity with the kids!
The spreadsheet already does support partial shares. I made an example this afternoon of an investor buying 0.4 shares of Apple and 0.8 shares of JP Morgan.
https://docs.google.com/spreadsheets/d/1pmKFOH58HLp8BiFtpOm8FBaNOeH369XtSZQ6KkrgDQg/edit#gid=37764951
If you flip between the Trade Log, Dashboard, and Your Portfolio Holdings tabs, you can see the calculations properly reflected. For example, 0.4 shares of AAPL have a market value of roughly $50 currently (given that one share is about $127).
In your spreadsheet, you’ll just need to increase the decimal points shown in the columns where the spreadsheet shows the number of shares you hold (I did this in the example I created). As it stands, the spreadsheet shows 0 decimals by default, but you can easily show more decimals by using the toolbar at the top of the sheet.
https://www.solveyourtech.com/increase-number-displayed-decimal-places-google-sheets/
Hey TMOAP,
Thanks a lot for all the great work you’ve been doing. You’ve put together some really amazing resources here!
I wanted to ask you a quick question about the Investment tracker 8.2, specifically the monthly performance tab.
For a few years I had a Mutual fund that does not show up in Google Finance anymore (no biggie :)).For the whole period I see the “Portfolio Starting Value” as 0 and “Portfolio Return” as N/A. This messes up all the monthly performance calculations.
Do you know why this could be happening? Is it because this mutual fund has no Google Finance data?
(The script ran fine from what I can see)
Thanks in advance and happy holidays
Not quite sure — can you share your spreadsheet with me by email? I can take a look further if so.
Is the spreadsheet able to handle multi-asset ETFs (with appropriate splits in constituents) like VBAL that has components of Fixed income & CDN, US, Intl and EM equity?
Hi Peter,
The spreadsheet can handle all-in-one / multi-asset ETFs fine for calculating market value, tracking gains / dividends, and performance calculations.
However, the re-balancing calculations won’t take the asset weightings of these funds into consideration.
On the Setup tab, you could create a new category to tag these as “Blended” or “All in one” or “Mixed” investments. This would distinguish them against pure equity or fixed income investments.
While the rest of the spreadsheet will function OK for these ETFs, the re-balancing calculations won’t take these all in one investments (and their respective equity / fixed income weightings) into consideration. As it is, those re-balancing calculations would need to be done manually.
In a future version of this spreadsheet, I’ll try to think of a way to allow the user to specify the category weightings within these all in one investments.
For inspiration, it might be worth looking at the multi-asset-class features in the CCP rebalancing spreadsheet:
https://canadiancouchpotato.com/2019/02/04/a-new-rebalancing-spreadsheet-for-etfs/
Thanks very much Ryan — I missed this comment earlier.
This is really helpful as a template, thanks for sharing!
Hello,
I just moved my data from the old version to the latest update.
It was a straight copy-paste of the values only, but under “Dashboard”, I am not able to see an option to look at my different accounts. Instead, under “Account Filter”, all I have is the “All” option and my different accounts which I pasted under “Investment Accounts” in the “Setup” tab are not there for selection.
Any help will be appreciated.
Thanks!
Hi Mohit,
I just checked the template version 8.2, the formulas and drop down menu for the account filter looks OK to me.
In your copy, please make sure to double check the setup tab, and make sure that you didn’t add new rows or delete rows.
Can you share your spreadsheet with me by email so that I can take a look?
Hi,
It started working after a couple of hours. Maybe was just taking time in processing all the data that I had copied from my previous version? *shrug*
Thanks!
The mysteries of google sheets…
Glad to hear it all worked out!
Hey mate, thanks again for the amazing spreadsheet. Was wondering if in a future version it’s possible to add more currencies? 5 currency might be enough for some, but those of us that invest in a lot of foreign stocks like myself it falls short. Thanks in advance!
Hi Omar,
I’ll keep that in mind for future versions. As it stands, I haven’t had many requests for supporting more than 5 currencies. Also, I want to avoid making the spreadsheet too heavy as it already runs a bit slow when changing dates / running the monthly performance script.
Cheers and happy holidays!
Thanks, happy holidays!
You too!
This is a great too- many thanks for making this public!
I have a question about exchange rates- sorry if I’m missing something obvious, but when adding a trade in the Trade Log, is there a way to manually add in the exchange rate at the time of the trade so that it accurately reflects the cost in my chosen currency (GBP)? Also, my trading fees are charged in GBP, which is often different to the currency of the trade itself. Many thanks in advance, and definitely worth the price of a coffee!
Hi Josh,
The coffee is much appreciated, thank you!
When you buy a ticker that’s not in your home currency, the spreadsheet will convert it back to your home currency based on the exchange rate given by google finance on that day.
This is an automated process that doesn’t require any user input.
You’re right that if the auto-pulled exchange rate isn’t exactly the same as what your trade was done at, your cost base won’t be calculated with exact precision.
You can see the exchange rates used if you go to the “Calc Trade Log” tab at the back, and look at column AJ. Again, these rates are pulled from google finance.
I did a few tests for different days and compared the rates versus what the Bank of Canada gives (https://www.bankofcanada.ca/rates/exchange/daily-exchange-rates/). The data given by google finance is either the same or just slightly off (e.g., 1.323 vs 1.322 for the CAD-USD rate).
Any inconsistencies should be quite small. However, If you’d like to manually input your own exchange rates for each trade, you can do that by modifying the column I mentioned previously (column AJ of the Calc Trade Log tab).
Please note that if you make manual updates on that column, you can no longer re-order / cut-and-paste / sort the rows on your Trade Log tab. If you do that, your manually inputted rates will be applied to the wrong rows.
—
For the second question about trading fees — on each row of the trade log tab, all amounts are assumed to be in the same currency as the stock that is being bought or sold. You cannot mix currencies on the same row. So, you’ll have to manually convert the fee amount.
For example, if you are buying stocks in USD, but your trading fee is 5 GBP, you can enter an amount of 6.75 USD in the trading fee column (5 GBP multiplied by an exchange rate of 1.35 USD per GBP).
—
I hope this helps!
Brilliant- this is really useful. Hope you have a good holiday season and thanks for taking the time to respond so quickly!
Cheers and happy new year
Bug / broken formula (or maybe data entry error)?
I’ve got v8.2 of the spreadsheet running. The Monthly Performance script is recording a credit for contributions, and then a debit in returns rather than a credit to portfolio value. Looks to me like a broken formula somewhere. Any ideas / fixes?
Hi DP,
Please read through the FAQ section of this page. This may shed some light on bad data entry or other common errors in the spreadsheet.
A couple other ideas:
– Double check your trade log — have you entered any negative numbers there? All numbers should be positive on that tab
– Try using a fresh version of the spreadsheet, as mentioned in item #5 of the FAQ
If none of the above works, you can share your spreadsheet with me by email and I can take a look to troubleshoot further.
Hi TMOAP,
I’ve been using the Portfolio Tracker since version 3 and absolutely love it, well worth the 3x donations made over the last 2 years.
I’ve noticed that the Cost Base is changing over time as the US/CAN exchange rate changes.
Should the Cost Base change along with the exchange rate, or should it stay the same as the day I bought it?
I use the Cost Base as part of a formula to determine my dividend yield on cost, then compare that to the current yield for each stock. If the Cost Base keeps fluctuating and the dividends do not, then my YOC fluctuates (but it shouldn’t – I think).
Your thoughts on this would be greatly appreciated.
Clarification added:
The Cost Base that I’m referring to is in the “Your Portfolio Holdings” tab.
And, I also just noticed down at the bottom of the “Dividends” tab (that my older version does not have) there is a yield on cost formula that I should be using instead of the one I currently use.
Hi Brian,
Thank you again for your generous support. I really appreciate it, and this allows me to continue improving the spreadsheet.
For your question on cost base, I think that in version 4.1 I fixed those formulas (on the Your Portfolio Holdings tab) to use a static exchange rate on the date of trade, rather than using the fluctuating current exchange rate.
You’re absolutely correct that the total cost base / cost base per share should not fluctuate based on a changing exchange rate.
Is it possible that you’re still using an older version of the sheet?
In the latest version 8.2, the total cost base in column U is calculated from the exchange rate on the day you traded. This exchange rate is static. Then, column Q is just the division to show it on a per share basis (column U divided by the number of shares held).
I downloaded the latest version and entered one purchase w/ dividends.
I entered a buy of 60 shares of KO at $46.45 on April 9, 2019 which created a cost basis of $3,729 CAN.
I entered 6 dividend transactions since then.
The current ACB in the Calc Trade Log, column AM = $3,675 (lower because of exchange rate decrease from 1.333 to 1.314).
The current Cost Base in the Your Portfolio Holdings, column U = $3,675 (not the original ACB).
I think the spreadsheet is changing the ACB as the exchange changes. Change my mind.
Hi Brian,
I dug through the issue this afternoon. My findings…
The short answer: you were absolutely correct, and I think I’ve fixed the issue! Please start from a fresh version of 8.2 and the adjusted cost base should be static now (unchanged even if the exchange rate fluctuates).
The long answer: on the Calc Trade Log tab, the previous column AM was converting the ACB using the exchange rate on the date of each trade. The issue with doing it this way was that when users would enter a dividend, the exchange rate adjusted ACB would now be calculated using the rate on the day of the dividend, rather than on the day that they actually made the buy trade. This causes the fluctuations you noticed.
The solution was to break that calculation into three columns:
– ACB pre trade (adjusted for exchange rate)
– Impact to ACB (adjusted for exchange rate)
– ACB post trade (adjusted for exchange rate) — simply the sum of the previous two values
This should work now because when a user enters a dividend, the impact to ACB will be nil.
Also just to clarify, the ACB calculations in local currency were being done correctly (and therefore haven’t changed), it’s just the exchange rate adjusted ACB values which are now fixed.
Thanks again for your eagle eye!
Thanks for your timely response, and I really appreciate the updating you do for all the people who value your work.
More Ko-fi’s on the way.
Thanks Brian for your generous support and keen eye on the spreadsheet. You’ve made it a better product.
Happy new year!
Great creative work on the sheet. I really like the investment portfolio tracker and want to use it. One question – how to include the ETF sector exposure data, which has multiple sectors, in the final pie chart. For example, I have ETFs/stocks dedicated to different sectors such as infotech, biotech, financials, industrials, healthcare, materials, etc. In addition, I have overall stock market ETFs such as VTI, VTWG, etc. I want to include % sector exposure from VTI and VTWG into my final sector exposure chart. I can get the % sector exposure information in another tab from a specific ETFs website. I greatly appreciate it if you could share a piece of function that generates the final pie chart containing all ETF’s combined exposure. Based on the net diversified exposure, I want to rebalance my portfolio in the future.
Hi Debanjan,
The current spreadsheet allows you to tag each holding with one custom investment category.
If you wanted to be able to tag holdings with multiple categories (and specify a percentage within each category), you’d need to build this yourself in your version of the sheet.
I’d recommend the following:
– Create a new tab
– Pull in the market value for each of your holdings; you can link to the “Your Portfolio Holdings tab”; show each holding as a row
– Add several columns to the tab for the number of categories you have (one column per category)
– In each column and for each holding, manually input the % weight in that category; for example, in the row for VTI you could specify 20% tech, 10% financials, 5% energy, etc… (please note that I just made up those numbers, you’d need to find the correct values)
– Build another table with the same format, where you multiply the market value for each holding by the various weights per category
– Sum up the totals by category
– Create a pie chart from the resulting final answers
Voila! It’s a bit of work to set up, but the above steps should work.
I hope this helps.
Great! Thanks for the detailed response with the steps. I appreciate your time and effort on the sheet. I a doing that already but thought of asking if you have a smarter way of doing it.
Enjoy holidays and a happy new year!
Best,
DG
Have you considered making a stripped-down version that runs on excel? I’m thinking a version where the sheet doesn’t care about the historical data nor about real time stock prices. And maybe the user can input the current stock’s current value on the Setup tab, so they can see their current portfolio’s value. The downside, of course, is that you can’t see how your portfolio has changed over time.
Hi J,
I think this can already be done by downloading the spreadsheet as an excel file, and then using the manual price entry columns on the Your Portfolio Holdings tab. You could also delete the Monthly Performance tab and any other outputs that would no longer work.
As you pointed out, the performance calculations would no longer work. However, you would be able to see your total portfolio value and breakdown by currency / account / category.
Hi, it is a nice spreadsheet with lots of feature.
I have one queston. I am managing my portfolio by my self but I have not all trade data. I have trade data since 2017 but not before. So how could we add ACB/book value
Hi Alkesh,
For any investments that you don’t have the full trade data for (dates / prices at which you bought your shares), I’d recommend just adding BUY transactions using today’s date, at today’s market price.
For these investments, you won’t be able to have historical performance reporting, but the calculations will be accurate from today onwards.
Thanks. That is a good way that performance reporting will be ok from now onwards.
Hi, My employer has a Group RRSP which has some index funds like BLK US Equity Index Reg or TDAM Low Vol Cdn Equity.
I would like to add these funds into the portfolio tracker as well but they are not available in Google trackers. How would you recommend adding funds like these? Should i just add a Stock Group RRSP and add a buy every time there is a deposit or seperate them in sections and add them manually or some other way altogether.
Love the spreadsheet and i am trying to enter all data but want to make sure i enter it correctly.
Your input will be appreciated. Thanks,
Hi Ali,
I’d recommend the following:
– Set up each of those funds with a separate ticker (e.g., $BLK, $TDAM — any name is fine as long as it doesn’t correspond to a different stock ticker on google finance)
– Input values in the manual price entry columns on the “Your Portfolio Holdings” tab — columns H, AF, and AL
– Each time you deposit into these funds, add a BUY transaction on the trade log
Fantastic resource, I honestly can’t believe it’s free. Thank you very much!
You’re welcome! I’d built a simple version of this spreadsheet a few years back, and decided to share with others since I had it lying around.
Over the past couple years, I’ve added many new features that I thought of myself or that have been suggested by helpful users all around the world.
It’s been a fun project!
Is there a way to group accounts so the dashboard can show “All RRSP”, and it will show info from the 3 RRSP accounts I have?
Hi Frank,
Unfortunately not — you can only filter on one account at a time. Perhaps I can find a way to do this in a future version of the spreadsheet.
One possible workaround would be to create a second version of the spreadsheet, where you only input the transactions for your 3 RRSP accounts into the trade log.
This is what I ended up doing yesterday. I have one for the whole portfolio and one for just the accounts that have tickers found in Google Finance.
I found the script went haywire when it was doing the monthly performance info/graphs when it hit my first purchase of a mutual fund. Showed a 5000% return ??
Hi Frank,
For the mutual fund, have you filled in manual price entry values in columns H, AF, and AL of the Your Portfolio Holdings tab?
For the performance calculations, that needs to be done for any holdings where google finance does not return a value.
I did the following:
Column H: Current price filled in
COlumn AF: No price information as the date was June 17, 2010, and I did not own any of the shares at that time
Column AM: Price information for December 31, 2020
Hi Frank,
The Monthly Performance tab uses a script that cycles through each month in your trading history, and calculates the performance in that month.
Since you don’t have a manual price filled in column AF (the starting period value) for your mutual fund, this means that as the script loops through the months, it thinks that the price return for your mutual is huge — it will jump from $0 to the price per share value in column AL.
As the script goes through the months in your trading history, the manual entry values are always staying the same.
For a comprehensive fix, I suggest this workaround:
– Make a new tab in your sheet, and download the share price history for those funds (column for date, and column for closing price) — perhaps you can get this data from Yahoo Finance?
– On the Your Portfolio Holdings tab, use a VLOOKUP formula in the manual price entry columns to pull the correct price from your share price database — you’ll need to add this formula in columns – H, AF, and AL, using the appropriate date reference each time
The net result of all of this is that you’ll have created your own pricing database for those funds, and will be pulling in the correct prices at different dates through the VLOOKUP formulas.
After you’ve done this, you can delete the data in columns N to T of the Monthly Performance tab, and then re-run the script.
—
Or, if you wanted a quicker fix, you could exclude mutual funds from your performance calculations.
To do this, delete all manual price entries for your mutual funds (remove the data in all 3 columns). Then, delete the data in columns N to T of the Monthly Performance tab, and then re-run the script.
—
I hope this helps!
I may try the Vlookup route this weekend! Thanks for the suggestion.
Cheers
Good day
I have just started poking around with MOAP and I think this may be the tool that helps me but to be sure…
I’m in Canada but trade often using US markets. Capital gains tracking needs to be done in CAD.
It seems for realized gains MOAP calculates the ACB using exchange rate at the time of the trade – I think?
One other thing – is the 250 ticker limit something I can change. I do not day trade per se, but do complete many swing trades and can see running up against this limit.
Thanks for great tool; I hope it fits my needs!
Hi Ron,
Correct — the spreadsheet uses the exchange rate at the time of the trade for the purposes of calculating adjusted cost base (ACB) and the realized gains on a sale.
The 250 ticker limit can’t be changed without some modifications to formulas on several tabs.
How would I record transactions like account fees & tax associated with my accounts? These are fees payable/service charges to my investment manager that are subtracted from the account itself. Thanks!
Hi Kenny,
First time I come across this question, and honestly not quite sure.
Here is an idea that perhaps you can test:
– Enter a new ticker called $ACCOUNT
– When you pay fees on the account itself (let’s assume $100), enter a sell transaction on the $ACCOUNT ticker, quantity of shares 0, amount per share 0, and a value of $100 in the trading fee column
The idea here is to reflect a trading fee of $100 in your overall account, without impacting the # of shares held of any of your holdings. The trading fee should be applied against your returns when calculating portfolio performance.
I hope this helps!
Thank you so much for your insight! I’m pretty fresh to this so all your feedback and resources REALLY really helps. Thank you very much
You’re welcome!
Hello,
My wife and I each have separate, but same actual, Vanguard Index Funds, the Vanguard 500. When I add two separate “buys” it combines them into one line entry on the Portfolio Display. I want them to stay separate line items. Anyway to do that?
Thx,
Hi Barry,
Unfortunately it’s not possible to show two rows for the same ticker. The spreadsheet will automatically aggregate all buys and sells for the ticker in the same row on the Your Portfolio Holdings tab.
One workaround would be to maintain two separate spreadsheets (one for you, one for your wife).
I did some research on why your spreadsheet wasn’t giving me the annual rate of return that I expected.
I’ve been using the $Cash method to track all cash coming into the account, converting dividends received to $Cash, etc, so that this spreadsheet has a complete picture of my total portfolio.
I’ve found that if I enter a $Cash buy (1st transaction showing cash added for future stock buys), then a $Cash sell with a corresponding Stock buy, then a Stock sell (at a slight profit) with a corresponding $Cash buy, then I end up with a large loss.
The overall loss is a result of 3 buys [2 $Cash, 1 Stock) and 2 sells [1 $Cash, 1 Stock), each around the same dollar amount. In the end, the $Cash balance ends where it started along with a slight increase for Stock trading profit.
As a workaround, on the Dashboard, I added a “Yes” or “No” field. Then I added a new column in the trade log which I use for $Cash [amount] only. The existing Qty of Units column for $Cash transactions would have a formula =if(Dashboard [Yes/No Field] = “Yes”, $Cash, 0) so that I can turn off all $Cash transactions (make qty = 0).
Then, if I want to calculate my true portfolio performance, I just switch the Dashboard field to “No”, check the rate of return, then turn the $Cash back on again by switching the Dashboard field to “Yes”.
This is something you might want to consider for your template for those of us who like to track cash balances in your spreadsheet.
Keep up the good work.
Hi Brian,
Thanks for flagging this, and for your clear explanation, as always.
I did a test in version 8.2 of the spreadsheet:
https://docs.google.com/spreadsheets/d/1wKCDteK98G-x4bO4Ap2YnmjnJVyIkP6PlLbAKKb1kxw/edit#gid=37764951
Using the following transactions:
– Buy $800 of $CASH
– Sell $800 of $CASH, and buy $800 worth of TSE:RY
– At the end of the year, sell $1,000 of TSE:RY and buy $1,000 of $CASH
So far, I’m aligned with you. There are 3 buys and 2 sells, with some trading profit generated.
On the Dashboard tab in the performance section, the performance results are:
– Portfolio starting value: $0
– Contributions (sum of all buys): $2,600
– Withdrawals (sum of all sells): $1,800
– Investment returns: $200
– Portfolio ending value: $1,000
– Annualized portfolio return: 25%
This seems OK to me. $800 of initial capital became $1,000 by the end of the year, giving an implied 25% return.
To make the $CASH method work, I’ve inputted a manual price entry value of $1 per share in all three manual columns on the Your Portfolio Holdings tab (H, AF, AL). Could you check if you’ve done the same, particularly in columns AF and AL?
I very well might be missing something here, but so far the spreadsheet looks OK to me as is.
Happy to discuss further.
You know, it’s just like when you take your squeeky car to the shop, and as soon as the mechanic looks at it, it stops.
Playing around, I found that I must have had my start date (for “Selected time Period”) the same date as my first trade, rather than what you did, which was a day before.
I find that my way really skews the performance, and your way calculates it properly.
I was a fool to have doubted you, thanks for clearing this up for me.
Ko-fi’s on me.
Thanks once again for your amazing support Brian.
Always nice to have a second pair of eyes on the calculations — with several new features added over the past months and years, I do start to get fuzzier on the details of how everything hangs together. Your feedback gives me a good reason to dig into it and re-acquaint myself.
In other words, I’m happy to be the mechanic
Hi,
I have a very small position in Bitcoin and Ethereum and would like to integrate with the rest of my portfolio.
What ticker should I use for this under the setup page?
Hi Areeb,
Please read through the FAQ section of this page, in particular item 11.
BTCUSD and ETHUSD should work for your case.
Hi,
Thank you for the awesome work you’re doing.
I’ve downloaded the latest version of the tracker and I’ve noticed that V8.20 uses a different formula to import market prices from Google Finance. It works fine for US securities but for other holdings (South Africa in my case) it seems to pull the prior day’s closing price if I set a custom date.
E.g. In version 8.0 the closing price for Harmony Gold (HAR) on 31 Dec 2020 listed on the JSE is 71.60 ZAR (the correct price). V 8.20 imports 70.74 ZAR (closing price of 30 Dec 2020) using a custom date at 31 Dec 20.
The new formula seems more simple but I assume time zones differences would cause this?
Hi Mark,
Thanks for pointing this out. First time I come across this and yes I think you’re right that it has to do with timezones.
I did some trial and error testing, and it seems that if you modify those formulas to use “+18/24” instead of “+16/24” throughout the formula (that term appears 4 times), it will now grab the right price for that stock.
I can’t say that I understand exactly why this works, or if it will depend on what time zone you live in.
Could you try modifying the formula to see if this fixes it?
Hi TMOAP,
Thank you for the work you’re doing.
I have used this tool for a while but recently i got a problem.
When i filled “Trade Log” to row 56,57…. the quantity of units in “Your Portfolio Holdings” did not update
What caused the problem??
Thank you
Hi Jim,
I think the problem would be the “Calc Trade Log” tab at the back. In columns B to J, this tab will replicate your trades, copying from the “Trade Log” tab. There are also many formulas on this tab which drive the spreadsheet calculations — in columns L to AO.
I think if you scroll down to row 5005, you’ll see that those formulas in columns L to AO stop at this point (i.e., they don’t appear in row 5006, 5007, etc…). You’ll just need to copy those formulas in L to AO, and then paste them downwards in the new rows. You can add more rows at the bottom of the Calc Trade Log and paste the formulas in L to AO even farther down. This will allow the spreadsheet to continue running as you add new trades.
In other words, if you go past the 5000 trade rows on the Trade Log tab, you also need to go to the Calc Trade Log tab and make sure that columns L and AO have the formulas dragged down as well.
I hope this helps!
I recently updated to the newest version of the spreadsheet from the previous version and noticed that a couple of my position’s cost base changed slightly. Particularly my Apple and Tesla cost basis seemed to increase by about $200.
I tripled checked if I copy and pasted everything correctly also.
I was just wondering if there is any reason behind this?
Thank you!
Hi Christian,
Are the differences in column K (cost base in local currency) — column U (cost base in home currency) — or both?
If it’s just for the home currency, I think that’s due to a bug fix I made in version 8.2 — given that the previous cost base calcs was taking into consideration some exchange rate fluctuations, even though it should not have.
The differences are in the home currency (column U). The cost basis is the same for the local currency so what you have said makes sense.
Thank you for answering so quickly!
OK great — you’re welcome!
Hi,
How do I enter a merger that occurred to one of my stocks (LVGO merged into TDOC)? I received a Div from the merger and my LVGO shares were removed and I was given a number of TDOC stocks to replace them with. The official details are “Livongo shareholders will receive 0.5920x shares of Teladoc Health plus cash of $11.33 for each Livongo share (including the special dividend declared by Livongo)”
Any help with this would be appreciated!
Thank you,
Hi Kevin,
On the date of the merger, I’d recommend inputting these transactions:
– Selling all of your shares of LVGO
– Buying new shares of TDOC
– Dividend transaction for your LVGO shares
The spreadsheet will therefore have converted your LVGO shares into TDOC shares, and will track your gains on TDOC from that date onwards.
I hope this helps!
Hi MOAP
I have to 2 different account share portfolios
I want to make an interactive dashboard for these two different portfolio on the same page that tracks profits & losses
This is awesome work!
I was thinking of using exactly the same approach to portfolio management by entering the trades – and luckily I found your site before attempting to do it myself.
One comment on exchange rate: My local currency is Euro and I end up buying a lot of stock in other currencies with my European broker. I wanted to simply enter the price in Euro for base cost instead of the end-of-the-day EUR-USD exchange rate calculated by the sheet. To do this I made following changes:
1. Added an extra column F on Trade Log – to represent “Total Euro Amount”. This shifts the “Total Amount (before trading Fee)” to column H.
2. Added the same column in Calc_Trade_Log
3. Changed the sheet Calc_Trade_Log column AK (“FX Rate”) to $Fn/$Hn
Works for perfectly.
Thanks again for the great work. Please let me know if the above requirement is valid more generally or am I misinterpreting the usage. It may very well be that the exchange rate variation over one day is not that great to make meaningful difference.
Hi Gaurav,
Thanks for your comment and also for the coffee!
When you buy a ticker that’s not in your home currency, the spreadsheet will convert it back to your home currency based on the exchange rate given by google finance on that day.
This is an automated process that doesn’t require any user input.
You’re right that if the auto-pulled exchange rate isn’t exactly the same as what your trade was done at, your cost base won’t be calculated with exact precision.
You can see the exchange rates used if you go to the “Calc Trade Log” tab at the back, and look at column AJ. Again, these rates are pulled from google finance.
I did a few tests for different days and compared the rates versus what the Bank of Canada gives (https://www.bankofcanada.ca/rates/exchange/daily-exchange-rates/). The data given by google finance is either the same or just slightly off (e.g., 1.323 vs 1.322 for the CAD-USD rate).
Any inconsistencies should be quite small.
The workaround method you did in your sheet sounds great, where you added a new column to input the cost base in euros, and then modify the Calc Trade Log column for exchange rate accordingly.
For most users I think that they would rather just input the cost in local currency and have the spreadsheet automatically convert back to home currency, rather than making a user input for local currency AND home currency.
Hey, as always, thank you for the constant support on this sheet – it’s amazing.
I just updated to 8.3 and when comparing to my previous version 8.0, it seems that the cost base changed in 8.3 vs what was in 8.0.
Not sure if it was intentional but it seems like it was in column AM in the “Calc Trade Log” where it was changing the ACB higher/lower to what I thought it should have been. Let me know if you want a copy of my sheet and I can show you a specific example. Thanks again.
Hi Brendan,
On the Your Portfolio Holdings tab, are the cost base differences happening in column K (cost base in local currency) — column U (cost base in home currency) — or both?
If it’s just for the home currency, I think that’s due to a bug fix I made in version 8.2 — given that the previous cost base calcs was taking into consideration some exchange rate fluctuations, even though it should not have.
Happy to review your spreadsheet if this still doesn’t make sense given the explanation above.
I wanted to create my own sheet and started creating one. Then Googled and found your sheet which is at least 1000 times better than mine. Enjoy a coffee on me!
Hi Ram, thanks for the coffee and happy to hear that you didn’t need to reinvent the wheel
Thanks for this sheet, it looks like it could be super promising if I can get this glitch to work. In my dashboard tab, it always lists that my total portfolio is 100% USD despite on the setup tab, I have both USD and CAD funds under Portfolio Holdings. I’ve tried refreshing a new sheet and pasting the trade data and setup data as values, the same issue happens. Is this some sort of glitch? In my trade log I put in the amount per unit without the currency symbol and kept it in the currency that it was traded in. Can you let me know what may be the issue? I also have some TD series in the setup tab but haven’t entered it in the trade log but that shouldn’t impact the whole currency pie in the dashboard. I’m worried that there’s something in the back end that is wrong if the currency is not weighted properly. Thus I can’t really trust the performance metrics calculated.
The issue I specifically mean is the “Portfolio by Currency” under the Dashboard tab. How do I fix the formula for that graph to get it to show accurately based on the default currency of that stock that was set up? Do I have to enter in the log and convert it all to CAD in the trade log?
Hi Janice,
I created an example of a portfolio which holds CAD and USD investments:
https://docs.google.com/spreadsheets/d/18zRMC1Xn5LPWkKErNYGE56AHHV0CEQj2EZoiT-VXrLg/edit#gid=1444538005
It looks like the spreadsheet is working as intended.
On the Setup tab, you’ll see I added one Canadian stock, and one US stock.
Then, on the Trade Log, I’ve added a buy transaction for each stock.
Now, flipping to the Dashboard tab, you’ll see the pie chart showing that the portfolio is made up of ~69% USD, and ~31% CAD.
In your spreadsheet, can you make sure that you’ve entered buy transactions on the Trade Log tab for at least one CAD stock and one USD stock?
Also, please make sure that you’ve selected All accounts on cell C4 of the Dashboard.
I hope this helps!
Thanks for quickly updating. I pasted from couple new sheets it didn’t track properly but somehow it worked with yours that you just sent. I also have a couple suggestions/questions:
1. ADR Fees – how do I track this?: I would like to be able to track ADR fees of holding foreign stocks directly on the same line as the dividend payout as that’s when it’s charged. I noticed that these fees I put on the dividends line doesn’t get updated to the stock holdings tab. I rather not have to add another separate line for this and condense it to one dividend line.
2. FX exchange Norbert’s Gambit – So far I’ve been tracking DLR as Canadian throughout and converting the USD sell price to Canadian. Not sure if there’s a better way of tracking.
3. Do you have any suggestions import quicker into this sheet with minimal error? I have Questrade, TD direct investing and also Wealth Trade. So I suppose QT I will have to just manually copy and paste from excel. But I find there’s room for error given I need to back track manual create formula the price purchased at for reinvested dividend. I also notice there is a slight average price difference for my VCN etf. I’m pretty sure I double checked my input but in any case have you come across where QT may be slightly off on average cost compare to the platform (I’m talking about 0.50~?).
I realize it’s such a beast to update, so I might just keep it to my active trades as dividend reinvested can be a lot to update and keep up. How often do you stay up to date with it?
Hi Janice,
1. To reflect the ADR fees in a single transaction row, you could just input the net dividend amount (gross dividend received minus ADR fee). For example, if you receive a dividend of $10 and pay $2 in ADR fees, you can just input the net $8 received.
2. Please read through the FAQ section of this page, and in particular the section about the $CASH workaround. This spreadsheet isn’t meant to track cash balances, so the easiest method would be to just ignore any cash contributions, withdrawals, or conversions between CAD and USD. Instead, use this spreadsheet to track your investments in stock, bonds, and ETFs.
3. You could keep a separate spreadsheet to organize your trades and make edits in bulk (adding values, rearranging rows, sorting, other data manipulation). You could bring all your trades into that new spreadsheet, make the necessary edits to conform it to the format required by this portfolio tracking spreadsheet, and then paste in the resulting data into the Trade Log tab.
I can’t comment on the cost base calculations that your broker shows.
I’m not a very active investor, so I only have a couple trades per month. I update my portfolio tracking spreadsheet every time I make a trade.
New to using a financial spreadsheet. The programme looks great and will so must more than I require.
A big thank you for giving access to all those interested. The coffee cup will be filled, well at least a few drops a bit later.
Question. Trade Log sheet. Can rows be added and not screw up the programme. I need to insert more rows.
Have a great day
Thanks
Bob
Hi Bob,
Thanks for offering to help on the caffeine front
Yes you can add new rows to the Trade Log tab.
Just note that if you go past row 5005, you’ll need to do the following:
– Go to the “Calc Trade Log” tab at the back of the spreadsheet
– Add more rows at the bottom of this tab as well
– In row 5005, column L to AQ, you’ll see some formulas there
– Copy those formulas, and then paste them down (still in columns L to AQ) until you get to the bottom of the sheet
Now everything should work fine.
If you add more rows on the Trade Log tab, you’ll just need to replicate this process again to add more rows to the Calc Trade Log tab, and paste down the formulas in column L to AQ.
The Calc Trade Log takes your transactions from the Trade Log tab, and then does a bunch of calculations off to the right side, which are then used to compute the outputs in the rest of the spreadsheet.
I hope this helps!
Hello,
I am having trouble making any sense of the “Monthly Performance” tab. My money-weighted returns are showing 40,000% in one month then -30,000% in another month, etc.
I don’t know how these numbers are being generated and so can’t use this information in any meaningful way.
Just to clarify, in the Trade Log tab, I only add stocks that have been bought and/or sold since the inception of my investment career. I, however, have never recorded cash deposits I have made from time to time. Is that required to get a more accurate returns in the “Monthly Performance” tab?
Thanks!
Hi Mohit,
You don’t need to track cash in the spreadsheet. I don’t track cash in my personal sheet.
The Monthly Performance tab works by using a script to cycle through each month in your trading history, copying the values in row 76 of the Dashboard tab, and then pasting those values onto the Monthly Performance tab.
Please read through the FAQ section of this page to see if those answers help.
A few other ideas:
– Are you tracking any investments that aren’t listed on google finance? In that case, you’ll need to use the manual price entry columns
– Try using a fresh copy of the spreadsheet — this will fix errors caused by formulas that were mistakenly deleted in your spreadsheet
Please try the steps above. If there are still issues, you can send me your spreadsheet by email and I can take a closer look.
I hope this helps!
Hi Bryan
I sent you an email before I realised I could comment here… Again I am so thankful for such hard work from you. Coffee coming. One thing, with crypto imports… I’m having a problem with entering chain link in Australian dollars. Should I be entering LINKAUD? If notmwhats the workaround for Google finance to understand it?
Thanks maaaaate!
Hi Adam,
You’re welcome, and thank you for helping to support my coffee habit!
If you can find a ticker that works on google finance, you can track that asset in the spreadsheet.
The problem sometimes is finding the right ticker! I did a quick google search but couldn’t find any ticker for CHAINLINK on google finance. Perhaps a more detailed search would turn up something.
You can also resort to using the manual price entry columns — please read through the FAQ section of this page for more details.
P.S. — my name is not Bryan
Where’d I get that from? apologies! I hate getting people’s names wrong. Is it Alan?
Thx again.
No worries! And yep, that’s me
Sorry – CHAINLINK
Awesome tool. Thanks so much for this!
Am I correct in noticing the Quantity of Units on the Portfolio Holdings tab only calculates to 4 digits. I have expanded it, but it only shows zeroes after 4 digits. this is an issue when tracking crypto currency. the trade log tab appears to be allowing enough digits, but what I have on trade log doesn’t add up to what shows on portfolio holdings even after I expand the number of digits.
Hi Rob,
You’re welcome! And thank you for the coffee earlier this morning, I really appreciate it
You’re right about the 4 decimal rounding on the Your Portfolio Holdings tab. I added the rounding because computers sometimes do funny math, where if you buy for example 103.15 shares, and then sell 103.15 shares, the spreadsheet will tell you that you actually still own 0.000000000218 shares (or something like that). Why this happens is beyond my pay grade.
So, I added the rounding to 4 decimal places so that positions would be shown as fully closed off when they should be. I need those values to be exactly zero for some formatting on that tab.
However, I see what you mean about cryptos, especially with BTC nearing $40,000 USD!!
I’ve now adjusted the template to round to 8 decimal places instead, which I think should be sufficient for crypto prices, while still rounding off the values to exactly zero for closed positions.
Please grab a fresh copy of the sheet and paste in your info (setup / trade log tab).
I hope this helps!
Thank you!
Hi again
Just wondering if you received my email and screen shots re-strange dates…?
Cheers
Hi there. I sent you an idea for anyone who is having difficulties with googlefinance recognising cryptos. Hope that helps.
What you have built is ingenious, laborious (for you, not us) and very clever. Indeed one of the best features is the comparative small amount of effort a user needs to get the sheets humming with reports & charts, but I’d like to suggest 1 additional feature that has caused me hours and hours and yes, hours of pain, and that is….. the reformatting of dates into the American mm-dd-yyyy format from the Anglos/Australian standard of dd-mm-yyyy.
As you know from my email, just 1 or 2 hiccups with converting dates from csv reports into mm-dd-yyyy format throws massive spanners into the works. The culprit is that googlesheets doesn’t clearly/readily confirm if a re-formatted date is in text or date format (if someone has the solution for this I’m all ears)…
Long story request please, could you please add a toggle type choice for either mm-dd-yyyy OR dd-mm-yyyy dates on the SET-UP page? The hours saved will help every single person outside of the US. You will be heralded & lauded even more wildly across this very globe!
And a YYYY-MM-DD would be nice! That is my preferred format, and also how Questrade reports are generated.
Note that you can update the format manually in the Trade Log but selecting a cell, then Format > Number > Custom Number, I set up mine as yyyy”-“mm”-“dd , then filled down. It all works, but this would need to be changed everywhere there is a date field.
Thanks Chris, that’s a good tip for changing the default date formats.
I’m not sure how to allow a user to toggle between different date formats easily (without doing the manual change you mentioned above), but will look into it.
Hi there, I just noticed in the last update you tweaked something related to currency conversion (Jan 12).
I just updated from the 8.2 to the new 8.3 spreadsheet and I noticed the Cost base values in converted currency are radically different than before.
Using the same set of sata, the numbers in Your Portfolio Holdings Q:Q and U:U are quite different than in 8.2.
Which ones are correct? Could this be affecting the portfolio return calculations?
Thanks in advance
Alessandro
Hi Alessandro,
You’re right, the currency-converted cost base calculations were tweaked in version 8.3. The local currency cost base values have stayed the same.
The cost base calculations get tricky when factoring in currency versions — I’ve struggled to get it right over the past couple updates, but I think that I’ve finally got it now.
I had been calculating cost base correctly in local currency, but got a bit lazy when calculating it in home currency. I needed to replicate the detailed calculations again, rather than doing a simple currency conversion.
– Added new columns AP and AQ on the Calc Trade Log tab
– Tweaked the formula in column AN
These currency-converted cost base calculations should be correct now, but please let me know if you see any errors.
I hope this helps!
Wondering if anyone uses this to track options or how that could be done?
Hi W,
This tool was built with fairly ‘vanilla’ investors in mind (buying and holding individual stocks or ETFs), so unfortunately it does not handle derivatives well.
I haven’t tested this, but I think that this solution may work:
– Add a new ticker symbol (for example, AAPL-CALL if you are buying calls on AAPL)
– When you buy a call, add a buy transaction on the AAPL-CALL ticker, reflecting the premium paid
– When the call is exercised or expires, enter a sell transaction on AAPL-CALL at the price at which you sell ($0 if the option expires)
The price of this ticker won’t be tracked in real time since google finance does not recognize the ticker, but once you close your position out, the returns will be reflected in the spreadsheet’s performance calculations.
I hope this helps.
Love this spreadsheet! Thanks for putting it together.
One feature I would like to see added is Interest or Capital Dividend as a Transaction Type on the Trade Log.
I’m earning interest on cryptocurrency and it would be cool to add the interest payments in the trade log and have the sheet calculate the updated Quantity of Units held for the different coins.
I second this request.
Hi Kevin,
Good idea — will keep this in mind for a future version of the sheet.
For now, you can record these transactions the same way that you’d input a reinvested dividend. Please see the FAQ. Long story short, you enter a dividend transaction, and then a buy transaction to reflect the increase in quantity of units.
How do we handle stocks that aren’t supported by Google finance, like anything on NEO? Is there a backup place the sheet will fetch price from if we input the ticker manually or can we not get the price?
From the FAQ above –
2) What ticker should I input on the Setup tab? and/or… What should I do if a stock or mutual fund isn’t searchable in the Google Finance database?
Please go to the google finance website (https://www.google.com/finance), type the name of the name of the company or fund in the search bar, and copy the ticker that Google Finance provides (the full ticker including the exchange).
Then, use that full ticker symbol in the investment portfolio tracker, on the Setup tab. Make sure that you delete any spaces in the ticker name.
For example, for the Bank of Nova Scotia company on the Toronto Stock Exchange, enter “TSE:BNS” instead of just “BNS”.
For any stocks or mutual funds which don’t appear on Google Finance, you can do the following in order to have them included in your total portfolio:
Add a new holding on the Setup tab — any ticker is fine as long as it isn’t an actual ticker on google finance (for example, “$TDB900” for the TD e-series 900 Canadian Index fund) Then, use the manual price entry columns on the Your Portfolio Holdings tab (columns H, AF, AL) — since Google Finance won’t return a price per share for these tickers automatically, the spreadsheet will use these manual entry prices instead
Now, the Dashboard tab will show these stocks or mutual funds in your total portfolio value.
Thanks Rob, much appreciated for helping out here!
Hi Jim,
As Rob mentioned in a reply to your comment, you’ll need to use the manual price entry columns for any stocks that aren’t supported by the Google Finance database.
Hey man I much appreciate this sheet.
Just want to note that I’ve never found “Performance by Investment Category” to be accurate. More specifically, when I sell a stock, it seems to mess this up entirely. Even if I sell it at the same price I bought it at (or lower!), the sheet tells me I suddenly have a huge return in that category. For example, I bought a stock, then sold it immediately at a slightly lower price (no dividends). Now my return for that category is 90% when before it was something like 10%.
I also sold my bonds a long time ago at maybe 5% more than I bought them at. They were my only investment in that category. Yet, to this day, my bonds category money-weighted return is 30% and I definitely didn’t hold them long enough to collect THAT many dividends.
For reference, I keep my Dashboard at a rolling 12 months under the performance section.
Is this a mistake or am I not correctly understanding how to use this section and/or exactly what XIRR is calculating?
Hi Frank,
That’s strange — the performance by investment category works fine in my personal copy of the spreadsheet.
Can you try refreshing in a new version of the spreadsheet? See the FAQ section, item 5.
If that doesn’t solve it, feel free to share your spreadsheet with me by email, and I can take a look to troubleshoot.
Noted the instructions in #23 Mergers.
Sell then buy the stocks.
TSE:HSE.PR.C to TSE:CVE.PR.C Neither TICKER works in Google Finance.
What would happen if in my current setting tab the symbobs for the stock were just changed to TSE:CVE.PR.C ?
Would the programme self destruct? I don’t wish to try it then have to rebuild the file.
Thanks
Bob
Hi Bob,
I searched up those tickers — I couldn’t find them on google finance either. It seems that google finance doesn’t support many preferred shares unfortunately.
Here’s what I’d recommend:
– Leave both tickers on your setup tab
– Since google finance doesn’t recognize those tickers, use the manual price entry columns (see item 2 of the FAQ section of this page)
– On the date that the merger occurred, sell your shares of TSE:HSE.PR.C and buy new shares of TSE:CVE.PR.C
This should work fine and won’t break the spreadsheet!
Comment Section/Leave a Reply
I would like to suggest adding a “Leave a Reply” pulldown menu.
It takes time to search for a particular subject/fix. Why not add a “Subject Line” to the “Leave a Reply” box. It could be a pull-down menu, with defined subjects, e.g. Structure, Formulas, etc or by Tabs. Pull-down menus give it structure and control.
Great spreadsheet
Have a nice day
Bob
Hi Bob, that’s a great suggestion.
It would certainly make the comment section easier to search through.
Honestly I’m not sure how to do this — think it would require some tinkering in the back end code for my website. I’m not sure how to do this, but I’ll keep it in mind / look for a solution.
Great work!! Very helpful!!
I have a quick question…
I have a few ADRs in my portfolio and dividends paid out are taxed(Foreign tax). My trading platform also charges an ADR fee. How do I account for this in the Trade Log?
Thanks in advance.
Hi Vin,
For fees / taxes charged on dividends, I think the simplest way would be to input your dividend amount — column G on the trade log — as the net amount received (gross amount minus any fees/taxes). For example, if you receive a dividend of $10 and pay $2 in ADR fees, you can just input the net $8 received.
Thanks for this awesome spreadsheet, it’s very useful!
One improvement suggestion for my hand: for all fellow non-american using the file it could be really nice to have the option to switch the date to the International format (DD-MM-YY) instead of the American one (MM-DD-YY).
As a non-American, I get a bit confused personally with those date structures and if i need to export my data date format mismatch can cause some issue.
Cheers,
Rob
Thanks for your comment Rob.
Agreed with you, would be a nice feature to allow a user to toggle the date formatting easily as they wish. Unfortunately I can’t think of a way to do this — I’ve done my searching around but to no avail.
For now, please note that you can update the format manually in the Trade Log by selecting the cells in the Date column, then Format > Number > Custom Number, and then type in your preferred format — e.g., DD-MM-YYYY or YYYY-MM-DD.
I’ve come across a weird issue and not sure if it’s me or the spreadsheet.
I changed my 401k holdings last month. I can see in the trade log that the sum of what I sold is equal to the amount that I purchased.
$136488 = $136488 and all transactions are in the same investment acct.
When I look in the monthly investment sheet it shows for Jamuary
84 12/31/2020 1/31/2021 Jan-2021 Starting value 421,957 Contributions 174,371 Withdrawals (162,221) Investment returns (140,017) Ending Value 294,090.
My portfolio value has dropped $140,000? I didnt sell anything for a loss. I just did a check of realized gain and I made 27%
Hi Jim,
A couple ideas:
– For the new investment that you purchased in January, did you enter the ticker on the Setup tab? Does Google Finance recognize that ticker?
– If Google Finance doesn’t recognize the ticker, you’ll need to use the manual price entry columns — please read through the FAQ
– Go to the Your Portfolio Holdings tab and find the row for the new investment you purchased — does the market value look off?
They are not recognized by Google Finance and I manually entered them in Column H Market Value (MANUAL INPUT) but NOT AF and AL.
BRB…
Hi Jim, yes for manual price entries all 3 columns need to be used.
Third times the charm. It was wrong on 8.2 without the entries in AF and AL. It was wrong in 8.3 without the entries in AF and AL. Once I started over with 8.3 and made sure AF and AL had those manual entries all is good with the monthly performance.
Great to hear!
Hello,
Great spreadsheets!! I was wondering if there is an excel version of it? I have all of your other sheets in Excel saved on my computer and would love to keep everything the same/stored in the same place
Hi Milon,
Glad to hear that you like the other sheets
Unfortunately I don’t have an excel version of this tool.
I haven’t been able to find a reliable way of getting current and historical stock/ETF price data to import automatically into excel.
While Office 365 has a new “Stocks” feature that lets you import real-time stock prices into excel, this unfortunately doesn’t work for historical prices (yesterday, last month, last year’s price, etc).
This spreadsheet uses historical pricing info to calculate portfolio performance between any two dates, so historical prices are a critical input.
Hello,
Thank you for your generosity.
While entering Crypto trades I discovered the Quantity of Units field will not accept 0.1000.
Hi Alan,
Please read through the FAQ — there’s an item about fractional shares. Long story short, the spreadsheet supports decimals / fractional shares, you just need to tweak the formatting to show those decimals!
Hi
How to transfer data from version 8.2 to 8.3 directly
Hi Sarwan,
Please read through the FAQ — item 5 in particular!
Is there any way to split up an ETF into multiple investment categories? E,g, for iShares XGRO I would like to split up how much is domestic/International bonds and how much is domestic/US/Internationalequities
Hi Gonen,
The spreadsheet can handle all-in-one / multi-asset ETFs fine for calculating market value, tracking gains / dividends, and performance calculations.
However, the re-balancing calculations won’t take the asset weightings of these funds into consideration.
On the Setup tab, you could create a new category to tag these as “Blended” or “All in one” or “Mixed” investments. This would distinguish them against pure equity or fixed income investments.
While the rest of the spreadsheet will function OK for these ETFs, the re-balancing calculations won’t take these all in one investments (and their respective equity / fixed income weightings) into consideration. As it is, those re-balancing calculations would need to be done manually.
In a future version of this spreadsheet, I’ll try to think of a way to allow the user to specify the category weightings within these all in one investments.
I have not used your spreadsheet yet.
i read it through but….
Really hats off to you! what a great work you have done.
usually i dont leave feedback but this one deserve a big shout.
i have a spreadsheet which covers 50% of your functionality.
but you have taken it to the next level
Thanks Carlo — much appreciated!
Is it possible to have dividends automatically populated based on the stocks you own?
Secondly, would it be possible to add a toggle to the “days trend” to convert it to a 52week range horizontal bar type view (like they do on SeekingAlpha portfolio – it just shows where we are in terms of price for a stock versus the last 52 weeks but with a line and a dot without the graph – it’s just a bit easier to scan and quickly understand where we stand)
Hi Simon,
1 — would be awesome if dividends could be pre-populated, based I haven’t found a good way to automatically import historical and upcoming dividend information into Google sheets. If you come across any workarounds, please let me know.
2 — Definitely would be a useful output to show visually where a stock is in the 52 week trading range. However, the spreadsheet already runs fairly slowly and as such I don’t want to add much more weight. That type of output would require adding 250 graphs into the spreadsheet! Right now, that visual is done using the built-in “sparkline” feature in google sheets, which is fairly speedy compared to custom charts.
A.W.E.S.O.M.E
It is the only word I can say
God bless you!
Cheers, thanks Chris
I wanted to ask if it is possible to add AUD as currency on your next version
all the best!
Hi Carlo,
You can do that easily on the Setup tab — just add AUD as one of your 5 currencies!
Hi
I wanted also to ask you whether there is a way to add more than 1 trading fees?
for example
we might have platform fees + exchange fee + stump duty at once and per transaction
>> at the moment I am adding all up and i input under the trading fee in the trading log
also
I dont know if it is possible to add “cost” such as platform trading fees especially for ISA (tax free accounts). where there is like a monthly fee
thanks
For now, all of those fees would need to be added under the single column for “Trading Fees” on the Trade Log.
I will keep that in mind for future versions though!
I have a feature request, which is the ability to track cash holdings.
I suggest that in the trading log sheet, have the ability to “deposit” cash, and the total cash amounts would be saved as a value in a new sheet (e.g. Cash Holdings). For example, in the Trade Log sheet, enter in a new data type “Deposit” (instead of Buy or Sell) in the Transaction Type column, enter in the currency type (e.g. USD, CAD, EUR) in the “Stock/ETF Symbol” column. I also suggest being able to add purchases of foreign currency to the trading log as well. For example, to buy euros with US dollars, Transaction Type remains “Buy” (or create a new data type e.g. Exchange), “USD→EUR” under “Stock/ETF Symbol” column, number of dollars bought under “Quantity of Units”, exchange rate under “Amount per unit”.
Also, whenever someone buys X amount stock, I suggest having the sheet subtract X amount from their current total amount of local currency. E.g. If you deposit $1500 of USD in a taxable account, the sheet adds this to your total USD cash holdings in a taxable account. If you buy $1000 of AAPL stock in a taxable account, it subtracts $1000 from your USD holdings (in a taxable account). Likewise, if you buy Airbus stock, it would subtract from your EUR cash holdings.
Implemented this way, your sheet can more accurately represent the transactions done in a brokerage account. Also, even if someone didn’t care to track their cash positions, the sheet would still work exactly as it did before (their cash holdings would just end up being negative, but they could just ignore/delete the Cash Holdings sheet).
I made a few rough modifications to your google sheet and implemented my ideas. So, you have an idea of what I’m referring to. Basically, I created a new sheet “Cash Holdings”, and I added a few more transaction types in the Trade Log, including currency exchange, deposit, withdrawal.
https://docs.google.com/spreadsheets/d/1HNDnJDIyT-ciM1gEmaUoGGcf9mOhhNtr8CtcW3voqGU/edit#gid=755788330
Thanks very much JW — I appreciate you taking the time to make these modifications.
I’m a bit swamped right now (with my day job, and a potential bug in this spreadsheet that I want to investigate further), so I don’t have the time to review in detail at the moment. But I will revisit this!
Thanks again.
Any thoughts on how to incorporate spinoffs (eg. Paypal spinning off of eBay)
Hi SM,
I haven’t tested this, but the following might work —
On the date of the spin-off, record two transactions on the trade log.
1) a dividend transaction on the parent company shares
2) a buy transaction where you purchase new shares of the spin-off ticker
The total $ amount should be equivalent between the two transactions.
This reflects the logic of what a spin-off is — the parent company is paying you a dividend, but instead of giving you cash, they are giving you shares of a new company instead.
Shouldn’t it be a return of capital transaction rather than a dividend transaction?
Hi,
When inputting the reinvested dividends, won’t this understate the return calculated in this spreadsheet since it is classified as the investor making an additional contribution. Would it make sense to create a new transaction type called ‘reinvested dividend’, thus meaning that the returns calculated would be total return, i.e. price appreciation and dividends, as opposed to simply price return?
Hi D,
The calculations should be OK — check out this example I created:
https://docs.google.com/spreadsheets/d/1j-YTMsSXUA6FiB02OrPnubtnnI6xPBq2lhYLQlCzr50/edit#gid=37764951
The Trade Log reflects an example scenario:
– Buy a stock for $5 per share
– Receive a 2% dividend yield
– At then end of the year, you sell at $5.50 per share, i.e., a 10% price return
The total return in this example should be 12% — composed of a 10% price return plus 2% dividend yield.
If you flip to the Dashboard tab in the performance section, you’ll see that the return of the portfolio is indeed 12% (in cell G78).
In the performance calculations, the spreadsheet already factors in unrealized gains, realized gains, and dividends. Also on a conceptual level, a reinvested dividend is the same thing as receiving the dividend as cash and then using that cash to buy new shares (this two-step process is how the spreadsheet treats it).
I hope this makes sense!
Hi,
Feature Request:
Any idea how I can go about entering a “Short Sale” transaction. It doesn’t seem to support it. This feature would be nice and a necessity for me as an active trader.
I also second JW’s idea of recording cash transactions and foreign exchange.
This is so incredibly! You’ve done a great job. thankyou.
Hi Ric,
Unfortunately this tool wasn’t built with short trades in mind. With that said, I did some testing and came up with this workaround:
– When you sell an investment short, the “Your Portfolio Holdings” tab will show a nil cost base, and a negative market value (e.g., selling 50 shares of AAPL at $150 per share will give you a market value of your position of -$7,500)
– When you close out the short by buying back, the tool will show that the position is closed out (no shares held)
– On the performance summary on the dashboard, it appears that everything is correctly calculated AFTER you close out the position; e.g., if you buy back your 50 shares of AAPL at $120, you’ll have an investment gain of $1,500; this will be shown on your performance chart and boosts your returns
– However, things will be wonky before you close out the short
– To give more accurate figures, I’d suggest recording both sides of the short trade (sell and buy) as soon as you initiate the trade. For example, when you initiate the short, add two transactions (buy and sell) at the exact same market price.
– As time goes on, you can change the price of the BUY transaction to reflect the current trading price
– When you close the short, change the date and price per share of the BUY transaction according to what actually happened (and leave the sell transaction the same)
In essence, you are doing a mark-to-market on your short trade by doing this
It’s a bit of a hack, but this should work!
Hope this helps.
Thank you, I’ll have a look at this hack for sure.
I appreciate your time for looking into it.
HI,
I added BTCCAD and ETHCAD on my Setup and Trade Log, but it doesn’t show any change on my dashobard. Either on the total amount or on the pizza graphs. Im using the very latest version of your Spreadhsheet.
AM I doing something wrong?
Thanks a lot in advance!
It also shows as a 100% loss on my Performance by Investment Category.
Hi Gabriel,
Can you look through item 11 in the FAQ and follow those instructions? When entering on the Setup tab, make sure you fill in all of the fields — for example:
– BTCCAD
– CAD
– Crypto
Then on the Trade Log tab, add a buy transaction for BTCCAD as you would for other assets.
If you still have issues, feel free to share your spreadsheet with me and I can take a look to troubleshoot.
Hello, i think the problem might be in the numbers of zeros.
I cant figure out the problem, how can I share with you? so you can take a quick look?
Thank you so much!
In your spreadsheet, go to the share settings and add my email address so that I can view & edit your sheet.
I’ll be able to troubleshoot after.
themeasureofaplan@gmail.com
I am able to search KLSE: Topglove on google finance, however entering (KLSE: TGLVY) or (KLSE: 7113) into your spreadsheet, it still shows up as an error. Is it possible to add this ticker or use yahoo finance instead of manually adding the price each time?
Hi Ming,
Unfortunately not. If the asset isn’t listed on google finance, or if google sheets can’t grab the value from google finance, the best workaround is to use the manual input columns.
Ty adding this code in the manual value filed.
Worked for me!
=IFNA(VALUE(IMPORTXML(“https://finance.yahoo.com/quote/” & “GRN.TO”, “//*[@class=””D(ib) Mend(20px)””]/span[1]”)))
Here the “GRN.TO” is the share ticker in yahoo finance.
That’s a good tip, thanks Sadi!
Please note though that this method probably won’t work for importing historical prices though (Dec-31-2020 for example). The spreadsheet uses historical prices when calculating performance.
Thanks!
Btw, you built a awesome tool! Loved it and so far all looks good!
Keep up the good work!
First of all, thank you for this. The spreadsheeet is amazing and I can’t imagine how long it took to build.
I am having issues with the dividend tracking, I enter the divided payment on the trade log as per instructions but when I open the dividend tab it is showing me that I have received 2 dividends rather than the dollar value (CAD) as it should.
Any suggestions?
Hi Jeremy,
The FAQ section has an example of how to enter dividend transactions.
If you receive the dividend as cash, enter one DIVIDEND transaction on the trade log.
If you re-invest the dividend for new shares, enter one DIVIDEND transaction and one BUY transaction.
Does that help? If not, you can share your spreadsheet with me and I can take a look to troubleshoot.
I doubled back to the faq’s, I seem to be putting it in correctly (entered on trade log as dividend, with the total $ amount in column G and tagged to TFSA account) but no dollar amounts show up on dividend tab. I’m sure its something dumb that I am doing, would be happy to share if your willing to look at it, just let me know hoe to do that. lol
In your spreadsheet share settings, just add my email address in order to give me view & edit permissions on your sheet.
Hi
This spread sheet is awesome, but I have one question:
If I remove the stock tickers from the setup page once my positions have been closed will it mess with the monthly performance/realized gains tabs? I’d like to only show my current positions. Also if I use this spreadsheet for a long time (which I plan to) and what happens if I reach the max 250 positions?
Hi Noah,
If you remove a ticker from the Setup tab, it will be removed from the performance / realized gains calculations.
To only show current positions, you could add a filter on the “Your Portfolio Holdings” tab, and filter on positions that are greater than 0 shares held.
The spreadsheet is capped at 250 tickers, so you’d need to start a new spreadsheet if you reach that limit. I don’t want to add more ticker capacity into the template because it slows down the calculation / refresh speed (even for those users who have less tickers) — and the spreadsheet already runs a bit slow.
I hope this helps.
Many thanks for making publishing this.
Suggestion: On the Trade Log page add a column labeled “Investment Category”.
I have multiple strategies that trade the same etfs or stocks.
For example I’ll trade TQQQ or QLD with multiple strategies. Long-term, Intermediate and Short term trades.
It would be very nice to be able to enter which strategy a given trade is in directly on the “Trade Log” page
This is so great, thanks for sharing!
Quick question though. I’m using Wealth Simple for trading, so there’s no commission, but I’m wondering your thoughts on how to best track currency-conversion fees. They charge 1.5% but they factor it in to the exchange rate.
Thanks for the help!
Hi Jay,
You could use a trading fee equal to 1.5% of your investment amount in these cases.
This will be treated as a trading fee and added to the cost base of your investment for performance tracking purposes.
Thank you very much! Your spreadsheet is incredible. I really appreciate you sharing it.
Another question though: I see your workaround for “short trades” above. The problem I’m having is that after I’ve closed the position, it still affects my realized gains weird. I’m going to see if I can figure out a work around, but if you have any suggestions let me know!
Hi Jay,
Thanks for your comment.
You’re right — in the short sale method I posted above, it results in correct performance calculations, but the realized gain calculation doesn’t work.
Try this instead:
– On the day that you close out the short trade, enter two transactions
– BUY trade, at the price you closed out
– SELL trade, at the initial price that you sold short at
– Make sure you enter the buy transaction first, and the sell transaction second
– Use the same date for both transactions
Now, the realized gain calculation should be correct.
I’ll try to think of a more elegant way to handle this in a future version.
Let me know if this helps!
follow up to my post on 2/19.
I follow between 15-20 different strategies. Is it possible to add another 10 lines to the “Investment Accounts” section without breaking the spreadsheet?
That way each “Account” could be its own trading strategy.
That would be a possible workaround instead of adding a “Investment Category” column to the Trade Log page
Hi Jaime,
It’s not possible to add more lines to the Setup tab and have those populate the outputs, without doing some “surgery” on a few other tabs.
I’ll keep it in mind for future versions of the sheet.
Thanks for your suggestions!
I am having an issue when inputting a trade for BTC. I have put in btc trades in the past, but now when I do it, it jumps my porfolio holdings over 200%. How can I fix this?
Hi Noah,
Please review the FAQ section of this page.
Item 11 talks about inputting crypto currency trades properly. Please go through your trade log and make sure the inputs are correct.
Also, I’d recommend doing a spreadsheet refresh as per item 5 of the FAQ if you still have issues with the sheet.
I hope this helps!
Amazing work, many thanks,
I did follow your instruction on changing the date format to DD-MM-YYYY and it didn’t work. Then I realised you have used Data Validation on it. Then I had to go to File>Spreadsheet Setting> and change locale and time zone to my country, then so far looking ok.
Regards,
Morty
Hi, I was kinda confused that I completed filled every transaction into Trade Log, but Profolio Holding, the Quantity of Units was wrong. What should I do?
(Here is my Link in Website)
Hi Lewis,
I looked through your sheet. Could you give a bit more detail on what looks incorrect to you (which ticker, what value you expect vs what value you see, etc.)?
Your Portfolio Holdings sheet shows 17 shares held for CRWD, which looks correct to me — given that on the trade log you bought 38 shares and sold 21 shares.
Also, for your $CASH holding, please follow the instructions in the FAQ section of this page. You should be using a price per share of $1.
I hope this helps!
This is amazing!
What would be the appropriate way to track crypto that’s NOT BTC or ETH?
Google Finance doesn’t seem to have data on other cryptocurrencies.
Hi Josh,
Unfortunately google finance doesn’t make it very easy, but it’s just a matter of finding the right ticker to input on the Setup tab.
Here are some that I’ve found:
Bitcoin — Currency:BTCUSD
Ether — Currency:ETHUSD
Lite Coin — Currency:LTCUSD
Bitcoin Cash — Currency:BCHUSD
Ripple — INDEXNASDAQ:XRPLX
You might be able to find others by using the google finance search bar, or through regular googling around.
If that doesn’t work, you’ll have to use the manual price entry columns — see the FAQ section for tips.
I hope this helps!
Hi,
Here’s me again!
Awesome spreadsheet as always.
I’d like to suggest a feature that could be implemented in the future.
I have some mutual funds in my portfolio that I’d like to track, but Google Finance don’t seems to have a lot of them.
I’ve searched online and found some info regarding µFunds (https://mufunds.com/). Is a tool for Google spreadsheets to track values from Morningstar and other sources. Basically all mutual funds are on Morningstar, so it can be useful.
I know that mutual funds are against the Moonshine Money philosophy and the Couch Potato investment strategy, but I think that can be a nice feature to make your spreadsheet even more complete than it is now.
I’m going to try implementing µFunds by myself, but you seems a lot more skillful than me.
Consider this as a starting point (I don’t know, maybe I’m the only one who cares about this feature ahah ).
).
If I’m not, and you think this could be a nice integration to have, it will be awesome.
Thanks again for the help that you give us!
Hi again Federico,
Thanks for your suggestion. I did some initial research on mufunds, looks really cool. Unfortunately it doesn’t seem like it has the ability to pull historical prices for mutual funds (e.g., price on Dec 31st, 2020).
This spreadsheet uses historical prices in order to calculate portfolio performance between any two given dates.
That being said, I’ll look into this more. Thanks again!
Hi,
Yeah, I was able to implement the current price tracking very easily but I’ve also noticed that unfortunately is not possible to track historical data.
I’m searching for some workarounds but it seems that Google Finance is the only way to do it.
The only way to see historical prices through Morningstar is by using the interactive graph, but I think is not possible to grab data from it.
I’ll keep searching for a solution too.
Thank you so much for the time that you put so far in researching this!
Just a quick update.
I’ve searched a bit more and I think that the best option is by using Investing.com.
It basically covers all mutual funds like Morningstar and it has all historical prices written in a clean way.
Just search any mutual fund and select General > Historical Data. From there you can select any data range and it gives you a big list of all historical prices.
The problem is that the main link page remain the same when you change dates, so I think is not possible to grab data using “IMPORTHTML”, but I’m not very practical with it and maybe you know other ways to do it.
Anyway I think I found a workaround. Not very practical, but I think it can do the job (I’ve not implemented it yet).
– Download all the historical data of all mutual funds from the starting date to today in CSV files from Investing.com.
– Create a new “History” page for every mutual fund in the Investment Portfolio Tracker and paste all the data from CSV files.
– Implement a Google Apps Script function to grab prices automatically from now on using mufunds (https://mufunds.com/history.html) so the “History” pages will continue to be updated automatically.
– Edit the Investment Portfolio Tracker formulas to grab the correct price from the “History” page based on the selected data range in the Dashboard.
I don’t know if it will work or not, but I will surely give it a try.
If you have any suggestion or feedback to do this better it will be amazing.
Anyway I hope that can be useful to you if you’ll decide to implement mutual funds in the spreadsheet in the future.
Have a nice day!
Thanks very much again Federico, this is super helpful.
I followed your steps, and I think everything you wrote makes sense.
You’re right that the URL doesn’t change on Investing.com when selecting a different date range, so I agree that IMPORTHTML probably won’t work to grab historical prices.
Also, your workaround solution (download the historical data, bring it into the portfolio tracking sheet, use a script to record the new daily values, use a lookup formula to get the right price at the right date) also looks great to me.
I think you’re being too humble about your spreadsheet skills!
I will do some more testing and think about if any of these manual steps can be automated somehow.
Thanks again for your help here
I track my mutual funds using mufunds, fetching the data from Morningstar or Investing.com as well. Don’t know how, but if this process could be automated that would be amazing!
There are no online service/spreadsheet like this one offering such a vast number of features for FREE! Thank you again for this spreadsheet.
Hi Federico, Y and everyone,
Maybe just a little too late to the party (more or less 5 years since the last comment on this topic haha), but I have written a Google Sheets Apps Script function to automatically bring the price of any instrument given an ISIN (not just mutual funds) and a specific date from the Yahoo Finance API.
This is a nice step forward towards the ideas commented here, finally letting us calculate portfolio performance between any two given dates automatically (apart from provinding price tracking of all those instruments, of course).
I am using it succesfully in my v.8.9 spreadsheet with some funds.
@TMOAP, if you like it, feel free to use it or even to integrate it in this wonderful spreadsheet. This is my contribution to this amazing work you’ve done. Thanks for all.
The link to the function and instructions:
https://gist.github.com/andcl/11c71cc34d2ce3484c805f1a42b6ef58
Love the tool!
Food for thought, but wouldn’t it make sense to have the Trading Fees in the home currency instead of local currency? (or is it just my broker that always displays the trading fees in euros?)
Many thanks again!
Thanks Kons! Happy to hear it
I think it depends on the broker — for example, my broker will charge the trading fee in Canadian dollars for Canadian stocks, and US dollars for US stocks.
For now I will leave it as is, I think it’s a bit clearer if the currency stays the same for the same trade log row.
Thanks for your suggestion though!
I’m having a problem with splits, but maybe I’m understanding the functionality incorrectly.
I’m looking at the realized gains tab for dates jan 1 2020 to dec 31 2020. However, the results are including a split for one stock that occurred in 2021.
If I change the date in the dashboard to dec 31 2020 the results in realized gains show correctly.
I wouldn’t think I’d have to change the date in the dashboard to get correct results in the realized gains tab. Is this correct?
Hi Paul,
It’s possible that there’s an error in the template — the calculations always get complicated when splits are involved — especially because the mechanics change depending on if the split is before / during / after the date range.
Can you share your spreadsheet with me by email (add my email address in the spreadsheet share settings) so that I can take a look to troubleshoot?
Hi,
Thank you for sharing your spreadsheet.
Is it possible to put somewhere the gains/losses of currency of a transaction. Imagine when I buy a stock, it will cost x dollars, with a exchange rate of that precise moment, along the time the exchange rate goes up or down, and that particular transaction will be affected with it.
How in your spreadsheet we can see that? I was inserting some transactions, and there’s always a gap of some euros, form what is the gain in reality and what the spreadsheet gives us.
Thank you
Hi Hugo,
On the “Your Portfolio Holdings” tab, you can see your unrealized gains for each ticker. There is a set of columns showing local currency, and a set of columns showing the values converted to your single home currency.
If you compare the gain % between local and common currency, you can see the gain/loss on the currency fluctuation.
I hope this helps!
Hi there,
Awesome tool.
Quick question – The dividends are rounding up. Am I able to set this up to not do that?
Thanks,
Disregard. Just had to increase decimals to reveal. Will chalk this one up to lack of coffee.
Haha no problem!
Hey there. Thanks for making and maintaining the spreadsheet. I have a question about DRIP’s
TD gives me the following
TD GLOBAL TECH LEADER ETF CG DIV -317 $177.90
TD GLOBAL TECH LEADER ETF DRIP 0 -$177.90
As my shares have not increased I believe this amount increases the “cost” of my shares and effects my ACB. How can I account for this in the spreadsheet.
Hope you can help. Thanks again.
Hi Jackson,
That looks like a “reinvested capital gains distribution”. More info here:
https://www.taxtips.ca/personaltax/investing/taxtreatment/etfs.htm
If so, just use the Reinvested Capital Gains Distribution transaction type on the trade log, with a total $ amount of $177.90.
This will increase your cost base by $177.90, but leave the # of shares constant.
For the past week there seems to be an issue with the dividend where the estimates are not being pulled over from Yahoo. For example TSE:BCE and TSE:LB.
Is there an easy fix for this instead of manually doing it?
Unfortunately I don’t think there’s an easy fix there. You could investigate using IMPORTXML or IMPORTHTML formulas to grab that data from another source.
Thanks! I’ll give it a shot!
As others have said – this spreadsheet is amazing. Thanks for putting it together and sharing.
I have 13 years of trading data (2100 rows in Trade Log) that I have been diligently entering over the last few days. Almost done now. I see that in “Trade Log” tab, Column “G” of Total amount behaves strangely. Some of the cells are filled with the E*F figure and those obviously work well in all other tabs.
However in some rows Column G remains empty. I tried copy-pasting the formula from a row that worked and it would put the formula. I manually tried to type the formula and still wouldn’t work. Any ideas?
Separately – if you ever update the mastersheet then how do I bring over any changes/features/fixes over to my copy of the google sheet?
Hi Gaurav,
I think the issue is just calculation speed.
Those formulas in column G will calculate eventually — you just might need to wait a few (or several) seconds, depending on your internet speed.
To upgrade to a new version of the sheet, please see the FAQ — item #5. Basically, you just download a new copy, and paste in your Setup / Trade Log data.
Hello,
I have purchased ETH on 3 occasions and sold once, the realized gains calculations are wrong. Not sure how to fix this.
Here is an example:
BUY 10 @300
BUY 2.5 @ 1800
BUY 1 @ 1500
SELL 1 $1650
Profit should show as $150 minus fees, however the gain shown is over $3k.
Please advise
Why would the profit be $150? Shouldn’t it be (1650-300) = $1350?
First-in first-out? So the 1 sold at $1650 costed $300 to you, didn’t it?
I figured that the calculation is done by computing the average buy price. It does not perform first-in-first-out.
Rather computes average buy for cost basis. So for your the average cost basis is
3000 + 4500 + 1500 = 9000 for 13.5 shares so cost is 666. so profit will be about $1K.
Hi Gaurav, that’s correct — thanks for helping out here!
Hi Ted,
As Gaurav pointed out, the cost base is an average across all of your buy transactions.
In this case, you’ve bought 12.5 shares at an average cost base of $666.
So, when you sell, you should see a gain of $984 ($1,650 sale price minus $666 cost base).
On which tab do you see the $3K gain? You should be looking at the Realized Gains tab.
If you still have issues, please read through the FAQ, and try the spreadsheet refresh mentioned in item #5.
Hi, first I really love your spreadsheets.
For crypto how can we handle mining or staking?
I.E. Mining is like a buy but its free.
Staking is like a dividend but instead of cash you get shares. Both should not change the cost base.
Thank you
Hi Zohan,
I haven’t tested either of these, but I’d suggest:
– For mining, just enter a normal buy transaction, but with a $0 per share purchase price
– For staking, enter a normal dividend transaction
Is there a way to change the dates calculated in the Monthly Performance Tab? By default it starts at 1-31-2010 and my portfolio only starts at 3/2020. Whenever I try to run the script it times out.
Nevermind, there’s something wrong in my copy of the spreadsheet. Started over and fixed the issue.
OK great, good to hear that this is solved. Cheers!
As much as I want to use this, I can’t get it to accept and pull symbol information no matter the combination I try. I’ve tried adding TSE:BCE and it says not a valid symbol on google finance. Even tried it without the TSE and no luck and this is with a copy of the sheet.
Hi everyone — it looks like the google sheets + google finance integration is temporarily broken.
See here: https://support.google.com/docs/thread/101835956?hl=en
The google community (and hopefully product team) is aware of this. I’m hoping that this will be fixed shortly.
Please hang tight!
So I’m not crazy then. haha That explains why I couldn’t get it to work no matter what I tried. Thanks for the info and I’m looking forward to this being fixed so I can finally give it a try.
Hi Doug, in case you didn’t see the other comments. Google fixed the issue!
The google finance + google sheets integration is up and running again.
I think the connection to google finance is messed up. When even I make another copy I’m having issues connecting to Google Finance
Something has broken since Monday.
I’m also having issues. It was working earlier today for me though.
Hi Reza and everyone else — in case you haven’t seen, Google has fixed the problem!
Google Finance + Google Sheets integration is back up and running.
seems that google finance is down. nothing loads anymore
Should be fixed now!
What an amazing effort. Fantastic.
Unfortunately no matter what I do (fresh copy, refresh, etc), the spreadsheet never successfully pulls stock information from Google Finance. I’ve tried various stock ticker symbols but not even the obvious ones (MSFT) work.
“When evaluating GOOGLEFINANCE, the query for the symbol: ‘MSFT’ returned no data.”
More confusingly the currencies are all valid.
Any idea why this might be the case?
Ah OK. So not a specific problem at my end, sorry.
Hi everyone — it looks like the google sheets + google finance integration is temporarily broken.
See here: https://support.google.com/docs/thread/101835956?hl=en
The google community (and hopefully product team) is aware of this. I’m hoping that this will be fixed shortly.
Please hang tight!
Thanks for your awesome spreadsheets and effort! Much appreciated
Hello everyone — it seems that the problem is fixed now!
In my personal spreadsheet, the market prices are loading in from google finance once again.
Seems that there was an outage in the integration between google finance + google sheets for roughly 24 hours.
All in all — everything seems to be working again! Happy tracking
I’ve sent you a couple beers. Looks like you’ve spent countless hours on this, and the end result is amazing
Enjoy!
Thanks very much Mike, I really appreciate it.
It’ll be a stout for me tonight!
Thank you for this excellent spreadsheet. I have a managed account and fees are charged qtrly as one transaction. How should I post that in the trade log?
Hi Mark,
I haven’t tested this, but the following workaround might help:
– On the Setup tab, add a new ticker called $FEES, or any other name that won’t return a stock price from google finance
– On the Trade log, add a buy transaction, with 0 shares bought / $0 per share / but with a total amount inputted in the Trading Fee column (corresponding to the fee you paid)
– Now, the spreadsheet should consider this fee as a drag on your overall portfolio performance
I hope this helps!
or maybe enter that as commission for the last trade?
Good Afternoon,
Firstly, I would like to state how pleased and grateful I am for the Investment Portfolio Tracker Spreadsheet you have created. It contains more than what anyone can ask for, especially the ability to track both stocks but also mutual funds (I use muFunds in the ‘Manual Input’ tab to fetch their NAV). Additionally, I am big on asset allocation and rebalancing to ensure I am staying within my risk management. Lastly, the fact that you allow everyone to access this valuable tool for free, especially for students like myself, is incredible and to me, says a lot about you as a person. As such, I wanted to personally thank you over email and let you know that I appreciate what you have done and your willingness to continue to update the spreadsheet.
I am building a passive income portfolio and therefore I am big on dividends, asset allocation, rebalancing and risk management. I came across this free tool online called the ‘Dividend Meter’:
http://dividendmeter.com/how-to-create-a-dividend-tracker-spreadsheet/
I thought I would share this with you to see if this is something you might find valuable to add to the spreadsheet in future updates.
Thank you again,
Kind Regards,
Thanks very much Y — I really appreciate the kind words.
Looks like an interesting spreadsheet at first glance, I’ll look through it in more detail later on!
Thanks again and cheers.
Can you please tell how to add mutual funds also? And
Is there any way I can input SIPs?
I can’t emphasize enough how impressed I am by all this work!
I have a question though: I don’t have access to all the transactions from over a decade any more because I changed brokers twice.
I’m wondering what the best way would be to start tracking my investments from now on. I’m only using tax-deferred or non-taxable accounts right now so I don’t need any of the cost basis for my tax returns.
I can think of two approaches:
1. Start tomorrow and pretend I had bought everything on that day. Enter the current market prices from tomorrow and the number of units I hold. That way I would track my portfolio from tomorrow on. Or:
2. For each security that I still hold, enter the transaction data. Ignore any securities that I’ve sold and haven’t re-bought.
Is there any benefit of using 2 over 1? Either way it’ll take a year until I can correctly track an annual return.
Hi Mark,
Since you don’t have the full history on your trades, I’d recommend going with option 1 — i.e., as if you bought everything today.
It’s the simplest way to get started, and this will let you track your performance accurately from today onwards.
I hope this helps!
Hey,
I love the tracker you put together, and it works like a charm except for 1 small part:
On the dashboard it cannot calculate my Investment returns properly. I traced it back to the initial value of my portfolio, which it cannot calculate. Any ideas for a solution?
Thanks in advance
Hi Rein,
The initial value of your portfolio is calculated based on the trades you entered on the trade log, and the implied value of those holdings at the start date. Please review your trade log to make sure the correct trades have been inputted.
If you don’t have your full history of trades to do this, I’d suggest setting the performance start date as today instead, so that you can track your performance accurately from today onwards.
Thanks a lot, this is a great tool. The only drawback is that few cryptos are listed on Google Finance. Once those are included this will be perfect.
Hello and thank you for this magnificent tool!
I believe i have found a mistake, that needs correcting.
I have been using this tool since ver.8.2!
Since then, my portfolio grew and now I own assets in USD and GBP.
I live in UK, so GBP is my main metrics to watch for (Your Portfolio Holdings) is in GBP.
On the Your Portfolio Holdings page, every asset is calculated in its native currency, which later is “translated” into GBP (for me), to show my Grand total.
However, in the GBP section, it doesn’t actually do that, for the Column Q (Cost base)
What happens is, Column F (Cost base in Native currency) equals Column Q (cost base in GBP)
As a result, the rest of the table calculates my Cost base (in USD) Minus current stock price (in GBP).
As GBP-calculated value is way less than USD value, the table calculates that I have much more cost base and less actual current market price, therefore – less gains (more loses).
Could you fix Column Q, please, to multiply the result by current USD/GBP (GBP/USD) rate, please?
Just a follow-up.
I went to Dashboard page and changed my main currency around.
This is what I found:
When I change main Currency (Dashboard) into USD, then all my GBP assets ARE calculated correctly in the Cost base (Column Q) from GBP, into USD.
When I change my main Currency (Dashboard) to EUR or GBP, none of the USD held assets are calculated correctly in Column Q for the actual Cost base, translated into EUR of GBP.
So in short, only the USD main currency works as intended in calculating correct Cost base (Column Q)
Hope this helps!
Oh, wait… That actually worked!
Changing the main currency around, somehow made the table kick-in and recalculate Column Q in the right numbers.
If you are like me, make sure you hit a good F5, every now and then…
Feel free to delete my last 3 comments… So silly…
Great tool, once again!
Hi Yordan,
Thanks for the comment and your testing!
I did some quick testing as well, and it looks like the sheet is working fine. I did a multi currency (GBP, USD) portfolio example, and the cost base was calculated correctly in the local currency and converted currency columns.
Indeed, refreshing the spreadsheet occasionally seems to fix many issues!
Google sheets / google finance gets bogged down sometimes, so a page refresh forces it to re-calculate and display the correct results.
Cheers.
Hello,
Why do you have a limit to only 5 currencies?
Any idea how to find ticker for Mawer funds? Mawer 150? tried 0P00009XRG.TO with no luck.
Hi Bill,
Unfortunately, many mutual funds aren’t supported on google finance. You could use the manual price entry columns — please see the FAQ section for tips.
Also, if you go back in the comment section to some of the older pages, a few users mentioned using a service called “mu funds” to get pricing data for mutual funds.
Is my understanding correct?
– This instructions work for the Dashboard data.
– However the Monthly Performance, relies on the Dashboard dates for calculation of columns N-T.
– This means that the Monthly Performance will be broken if the ticker isn’t in Google Finance, as the Dashboard calculations cannot be updated without the live data, is that correct?
Not sure if there’s a workaround. Perhaps having something similar to the Custom Benchmark Data sheet, but for your fund’s historical prices that the Dashboard / Your Portfolio Holdings can use when Google bails?
(I didn’t realise there were lots of old comment pages and you hinted at this elsewhere, sorry!)
In any case I just confirmed this theory and it does indeed work:
1. Create a new sheet with istorical data for the fund. You’ll need a Date column and a Value at close column. You need data that goes as far back as your “start date” (Monthly Performance!K3).
2. Modify H, AF, and AL using VLOOKUP() on the new sheet for relevant dates.
3. Clear N-T of Monthly performance and recalculate.
Thank you!
Hi Daniel,
Thank you for following up on your original question.
And yes, that’s exactly what I would recommend! This effectively builds your own pricing database for that stock, and uses a lookup formula to pull in the correct price at each month end.
Cheers.
This is an amazing tool. Thanks so much for putting it together. I have a question about DRIPs. As I read your FAQ’s it says that you should use two sepearate transaction if you are reinvesting dividends. A dividend transaction and a buy transaction. So as an example, if I have 10 shares of ABC and I add a buy transaction for 10 shares it adds the 10 dividend shares (at a whatever the tiny amount per share is) to the total shares. So my 10 becomes 20 on the dashboard. Am I doing something wrong?
Nevermind. My broker just gives me the information in a weird format. I figured it out.
OK great — good to hear that you sorted it out. Happy tracking!
This is pretty great and hi-tech tool. Thanks for sharing this openly with the community. I have a quick question – Will this tool handle cash settlements as well. At first glance it didn’t seem like it.
For example when I sell a stock proceeds go to settlement acct(cash acct) and when I buy stock it takes from the settlement acct. Also at a given day I wanted to know how much cash I have in a given account. Curious if this has this capability.
Please let me know.
Hi Manny,
Please read through the FAQ section, particularly item 7 which talks about cash tracking.
I think there’s a bug in the monthly performance calculations. What would be causing this to happen? It makes it sound like I went bankrupt then got the money back the next month? I looked at my tradelog and nothing happens that would cause this.
https://imgur.com/a/YGvbct7
Hi A,
Please see the FAQ section of this page — item 8. Can you can try deleting the data in columns N to T, and then re-running the script?
[…] no la hubiera podido dejar a mi gusto sin tener unas plantillas en que fijarme. Sus creadores son The Measure of a Plan, cuya cartera es INCREÍBLE y la más completa, mucho mejor que la mía; Old School Value, más […]
Greetings,
Let me first thank you for your spreadsheet. I am only entering the tickers at this point but I can see how this is shaping to be a very useful tool.
My question: I can’t seem to find the Crypto Investment Category as in your Q&A example and I am not sure how to enter this in the trade log either when I purchased a division of bitcoin on occasion. Thank you for your assistance
Hi Vincent,
Please see this example portfolio which contains Bitcoin:
https://docs.google.com/spreadsheets/d/1kvD45mg77PUgohzMG4jVp3wU3BTZnrtBN7SBc7B_dOE/edit#gid=559054297
Check out the Setup tab and Trade Log tab.
This shows how to enter a crypto ticker, and how to enter a crypto trade. Basically, it’s the same idea as when you enter stocks or ETFs.
Excellent. thank you for taking the time to answer my question. I am afraid I have more question…how do I register my TFSA account in the spreadsheet. I see the TFSA account option. if I enter the tickers seperately in the portfolio holdings, how do I indicate that they are part of a TFSA account. Thank you for time and assistance
Hi Vincent,
When you enter your trades on the Trade Log tab, you indicate which account the trade was made in (e.g., TFSA, RRSP, taxable account, etc.)
I’ve double-checked all my inputs…and the spreadsheet’s totals (on the Dashboard) almost match my brokerage account totals but they’re off.
It’s a relatively small amount (like, $40 or so light on one account) but it bothers me that I can’t figure out why there’s a discrepancy – does anyone have any insight as to why this might be happening?
Hi Michael,
I’m guessing it has to do with the market pricing data for your holdings, or the currency rates being used (if you have investments in multiple currencies in your portfolio).
Check the $ per share column on the Your Portfolio Holdings tab, and see if you can find comparable information from your broker about the pricing data they’re using to calculate your total portfolio value.
I suspect there might be some slight discrepancies — for example, this spreadsheet using today’s market price, but your broker using yesterday’s close price.
This is a great tool and something I’ve been searching for in order to get out of the Quicken environment. I’ve done some testing and seem to be running into a couple of issues:
1. The size of the trade log. It is set up with about 4000 rows. I’ll need close to 7000 rows or more (each reinvested dividend takes 2 rows of data and I’ve got a lot of dividend stocks) to fit all my data from the past 22 years.
2. While investigation where the trade log data goes, I ended up on the calc trade log sheet. The formulas (column L as an example) only reference to row 201 in the setup sheet, which seems to exclude the last 100 or so portfolio holdings. Am I missing something about how this sheet works?
To what extent has this file been tested for “larger” amounts of data?
Hi Adam,
Thanking for flagging the Calc Trade Log column L issue. I’ve fixed that now to refer to row 301 instead of row 201. Also fixed it in a couple other places. I had forgotten to update those cell references when I last added +100 tickers to the sheet.
You can add more rows to the Trade Log tab. This just requires adding more rows to the Calc Trade Log tab as well, and copy/pasting down the formulas in column L and beyond. I think I wrote a more detailed explanation of this process on one of the older comment pages.
I haven’t rigorously tested the spreadsheet when using hundreds of tickers / many thousands of trade entries. My personal portfolio has only had a dozen or so tickers over the past several years.
That being said, please feel free to “stretch the limits” and let me know what you find
Does the money weighted return table (starting row 382) on the calculations tab have to be expanded? It only has about 1800 rows, but I think each transaction is/should have a line on it.
In column AI on the Your Portfolio Holdings tab, I have a “Value” on all USD holdings (CAD is my base currency). When I trace the formula it leads me to the currency tables and in particular, the one that starts on row 349 on the calculations tab which has NA in most cells.
With more data, the spreadsheet is slow and always seems to be calculating. Any consideration for employing the technique to paste as values in the large data tables so that the formula only remains on the top row and data is only dynamic when something new is added or changed. Happy to go into more detail on what I mean here if you’d like.
Hi Adam,
Yes you’re right about the money weighted return table.
Unfortunately I don’t think this tool is right for someone with tens of thousands of trade log entries.
As you’ve seen, google sheets becomes very slow.
For the “paste as values” method, this could work, but it would require running more scripts in the spreadsheet. That’s not something I want to do since google makes it very cumbersome / a bit scary for users to run those scripts. It makes you click through a few menus with warnings like “unsafe” or “give access to your google account”, even though the script is harmless and only does copy/paste within the spreadsheet.
I’ll think more about better handling of large data sets, but not clear to me the best way to do this while keeping the spreadsheet light / easy to use for investors with smaller portfolios.
This is amazing. Thank you so much for this!
Do you have any advice on how I can incorporate asset allocation ETFs or global equity ETFs (ie. VT, VEQT, XAW)? I have VEQT in one account and VT + VCN in another account so the rebalancing tab is not able to determine how much I need to buy/sell for each ETF because it doesn’t understand that I want 80% of my entire portfolio in equities, of which I want 25% in Canadian equity and 75% in US/Intl/Emg equity. I separate them this way because I buy the latter in USD. Any ideas?
Hi Canuck,
Unfortunately, there isn’t a great way to categorize these “asset allocation” funds in the portfolio tracker. On the Setup tab, you could create a new investment category to tag these as “Asset Allocation” or “All in one” investments. This would distinguish them against pure equity or fixed income investments.
While the rest of the spreadsheet will function OK for these ETFs, the re-balancing calculations won’t take these all in one investments (and their respective equity / fixed income weightings) into consideration. As it is, those re-balancing calculations would need to be done manually.
In a future version of this spreadsheet, I’ll try to allow the user to specify the category weightings within these asset allocation investments.
Hi!
I have been looking into M1 Finance and I am a big fan of its ‘Pie Charts’, where each of your asset allocations can be tracked individually. Unfortunately, M1 FInance is not available in Australia.
Is there anyway I can set this up in this amazing Investment Portfolio Tracker?
It is more to be able to see which “pie” performs the best over time to better be able to rebalance each sector over time.
Thank you heaps for everything!
Also, is there a way to sort the holdings in my ‘Portfolio Tracker’ according to investments category or Unrealized Gain -$?
Cheers!
Hi Y,
On the Dashboard tab, there is a pie chart which breaks down your total portfolio value between your investment categories.
Further down in the Performance section, there’s a table which shows your performance metrics broken down by investment category.
Unfortunately, I don’t think you can sort within the Your Portfolio Holdings tab. You could copy/paste that data into a new tab (pasting as values), and then sort / do further analysis on that new tab.
I hope this helps!
Hey,
I love this tracker!
Is there a possibility to include a ‘watchlist’ tab in future updates where one can sort potential buys depending on target price?
Maybe red colour when it is above, yellow at target price and green colour when the stock is below (undervalued).
Regardless, thank you heaps for this helpful tool!
Thanks Josh — I will keep a “watchlist” tab in mind for a future version of the tool.
I’m so excited to have found this it feels like christmas and I just got a shiny new toy! This is fantastic work. I’ll be donating 5$ a year as long as I use this you’ve saved me countless hours of building one for myself, and frankly I couldn’t have done half as good a job.
Two suggestions:
Being able to put stocks into a “basket” so that they are essentially evaluated as a single investment would be great. It’s not quite the same as categories. For example, I could put Toyota, Honda, and GM in the “CARS” basket and then I would only have the “CARS” entry in my holdings, in realized gains, etc.
I’d like to see Realized Gains in the “Holdings” tab, but that might be just me.
Thank you for your work this is super valuable to me.
Thanks S — your support is much appreciated! I will keep those suggestions in mind for future versions of the tool.
Hi,
I love the spreadsheet!
The only issue is when I have ran the script for my march 2021 monthly performance, the S&P500 data says it is 0 meaning the S&P500 data shows -100% return? Is anyone else having this issue or know how to resolve it? Specifically, cell B498 in the S&P 500 data tab is recorded as “0”.
Really appreciate any help!
Cheers
Ignore me, I think the figures there is a 12 hour delay in the figures releasing. It is working perfectly now.
Thanks Dan for confirming! Glad to hear all is well.
Thats an Amazing sheet, well done.
I tried to use the workaround for Selling Call Options then Buying it, it doesnt work properly, the only way to fix it, is to use a sequence that the formulas in the sheet would honor, so, let’s say you sold a cover call.
While you would BTC (Buy to Close) or let it expire worthless, you have to enter the Buying in trade log in a prior “row” before the Selling, even if you naturally Sold to Open first.
Otherwise, in the realized gain section, the BTC piece of the transaction wont have any effect on the formulas.
Hi,
Started to use the sheet and noticed the message “! Column 2 must be numeric.” in the Dashboard tab (second graph).
Any idea why?
Thx
FerrisWheel
Hi Ferris,
Please read through the Troubleshooting and FAQ sections of this page. A spreadsheet refresh might help.
Hi, I just took a copy of the spreadsheet. Did you change anything in the code the past week?
Tx
FW
You were right. The refresh worked.
Thx alot!
OK great, you’re welcome! And just to confirm, I haven’t changed the template in the past few weeks.
I am filling out the spreadsheet now, but I ran into an issue.
Back in 2015 I hired a wealth manager and they transferred a bunch of stocks from one brokerage to another.
I have the quantity of each stock transferred, but there is not a dollar amount associated with each equity. Will this be an issue ?
Also should I label each transfer as a “buy” transaction or is there a better option?
This is a follow up to my question.
In addition to managing “transfer” transactions I also have “cash” and “fee” Transactions. Cash is associated with buy and Fee is associated with sell (I’m assuming). I added them to the set up tab.
You would be doing me a huge favor to do a quick check on my work for my 2015 transactions before I continued though 2021. Any help is appreciated.
Working Portfolio Tracker:
https://docs.google.com/spreadsheets/d/1ks4HEjnhIsvaIPmZUS8ipie1pyaCpRkF_Y_Iy19_Zlc/edit?usp=sharing
Actual Transactions:
https://docs.google.com/spreadsheets/d/1C55X8q6ua6F7XFtGkaTwwmBzhzHS9NuYaOX7ECK3sLA/edit?usp=sharing
Actually, I just realized my question is really similar to Harry’s so you’re probably good to just answer this one since they were in first.
Thanks again!
Hi Harry,
If you don’t have your full transaction history about when those stocks were first bought (and the price), I’d suggest just entering those transfers as “buy” transactions on that date, using the market price on that day as the cost per share.
This effectively assumes that you first bought those shares on that date.
Awesome spreadsheet! Though, I am struggling with something – As I buy in Canadian Dollars (and that is the selected currency on the dashboard tab), all the amounts in the trade log sheet are in Canadian Dollars. But all my returns are negative (because Market value from Google Finance in your portfolio page is in USD). My Cost is in CAD but market value is in USD, therefore the returns are negative. Am I doing something wrong? I would assume the market value will be converted to CAD automatically, but thats not happening. Any help would be highly appreciated!
Hi Rohit,
When you enter your trades on the Trade Log tab, please use the “local currency” values.
i.e., for your USD stocks, enter them in USD. For CAD stocks, enter them in CAD, etc…
All other calculations should work fine after this. The spreadsheet will then convert everything back to CAD for you automatically when presenting outputs on the Dashboard tab.
Hello, thanks a ton for the awesome document. It’s obvious a ton of effort and care went into the setup!!
I’ve been working through entering the historical transactions I printed out for my (managed) investment accounts and there’s transaction type I’m not sure how to enter in the Trade Log: “Merger Security Exchanged”. I can see the old/new Security IDs and the Share Quantity but there are no amounts.
Is this type of transaction something that can be entered?
Hi Sarah,
For these types of transactions, I’d recommend entering a SELL transaction on the old ticker, and a BUY transaction for the new ticker.
If you don’t have the $ amount per share, you can look up the market price on google finance or yahoo finance on the relevant date, and use that as an approximation.
Effectively, you are telling the spreadsheet to “transfer” one ticker into another on that date.
I hope this helps!
Perfect, thank you!
Hi!
I love yout spreadsheet, Idid built on Excel and importing Live price from TOS(TD).
Is there anyway, I can Lively import OTC market price, Such AS: AABB, NWTT.
I can find in Google Financ.
Thanks in advance
It’s issues when OTC price at 4 Decimal.
Do we have anyway to fix it.
Hi Hiten,
Please read through the FAQ section of this page. There are some tips there.
The trick is to find the right ticker that works on google finance. This takes some searching around.
OTCMKTS:AABB seems to work for Asia Broadband.
If you can’t find the right ticker (or if google finance doesn’t support a stock), you can always use the manual price entry columns — please see the FAQ.
your spreadsheet is simply amazing, I’ll certainly buy you a coffee !
I’m actually overseas so all my holdings cannot feed of google Finance. Can I just modify columns AQ & AR in Portfolio holidngs? Just want to make sure they refer to the manual price inputs.
Also, I was wondering if I can just delete the monthly performance sheet to make the workbook maybe lighter? No impact there I guess.
Thanks again !
Hi Nick,
Coffee is always appreciated!
Yes you can modify columns AQ and AR, those are just output columns.
And yes, if you don’t need the Monthly Performance tab you can just delete it.
Cheers!
The monthly performance seems nice but the warning from Google is a bit worrying: The app is requesting access to sensitive info in your Google Account.
Do you know what kinda of info it needs?
Hi Nick,
Yes unfortunately google forces that scary warning to appear.
I’ve written a script (a.k.a., a few lines of code) that runs when you click the “Go!” button.
This allows the spreadsheet to cycle through each month in your trading history and record the performance of your portfolio — starting value, contributions, withdrawals, investment returns, and the ending value.
Specifically, the script will copy the numbers in row 76 of the Dashboard tab, and then paste those values into columns N to T of the Monthly Performance tab.
The spreadsheet doesn’t have access to any of account info, other files, etc.. All is does is change the date values and copy/paste results as it goes.
Hi,
Its a great sheet and have loved adding my portfolio to it. It tracks my Stocks and Mutual Funds brilliantly.
I was wondering how to add my fixed deposits into this. Currently I am tracking them as Fixed Income with cost as $1 and current price as $1. I enter the interest received as dividends. And if the interest is cumulative, then I add another Buy entry with the interest amount. Is this correct approach? Will this break XIRR calculations?
Cheers.
Hi Gaurav,
Yes your method for fixed income should work!
Let’s take an example of buying $1,000 of fixed income investments.
The initial transaction would be a BUY of 1,000 units, cost of $1 per share.
Now, if you receive interest of $20, you would input a dividend of $20.
If you reinvest that $20 to buy more units, you would input a second transaction — BUY 20 units at $1 per share.
I hope this helps!
I really Like the looks of your work!
I have been partly using it for sometime now.
I say “partly” because sadly Google Finance will NOT find any of my Canadian Mutual Funds investments, been trying for years.
I read that you really like Excel but don’t use it because of the lack of Historic Data.
I use Excel 365 and the “Stock” function is really great, I have had NO issues find investments.
They I assume, recently have History for Currency Exchange and the investments also!
I am a what you would consider a very “Basic Level” at spreadsheets so the question.
Would it be possible to convert the Google version to a Excel Version.
Hi Johnny,
Good to know about Excel 365 adding historical stock data!
Unfortunately I don’t have a subscription to Office 365 / Excel 365. I am stuck in the relative dark ages using Excel 2016…
Perhaps in the future if I decide to upgrade!
Hi,
Thanks for the frequent update! This is getting better and better!
I have a question regarding recording CG DIV (Capital Gain Dividend) from my VGRO. It didn’t give me cash and it did not increase my stock holding. How should I input in the chart?
To be honest, I am not too familiar with the CG div concept and how it affect ACB / taxes.
Hi John,
That “CG DIV” transaction sounds like a Reinvested Capital Gains Distribution.
This is when a fund makes a taxable distribution, but it’s reinvested back into the fund as opposed to being paid out in cash.
You can use the “Reinvested Capital Gains Distribution” transaction type on the Trade Log. This will increase the cost base of your investment on a dollar-for-dollar basis.
Hi MoaP,
I’m in the UK and my base currency is GBP but Google Finance returns quotes for UK companies in GBp (pence rather than pounds).
Unfortunately breaks the whole spreadsheet for me unless I start to add “/100” to all the google fianance calls for UK stocks.
I’d be grateful for any thoughts.
thanks
Phil
Doh, just seen the column on the Setup page!
good job
Hi Phil — glad you saw that column, and thank you for following up on your original question. Cheers!
Is there a way to hide any ticker with zero balance/shares from the portfolio holdings so to only see ones with.
Hi Marcus, you could add a filter onto the column “Quantity of Units”, and then filter out any holdings which have 0 shares.
Ok ok. How would one do that?
Please search online — there are tutorials that can walk you through adding filters in google sheets.
For example: https://zapier.com/blog/how-to-filter-in-google-sheets/
Thank you. I was able to filter what I needed based on that link provided.
Hi there … is there a way to pull in 4 decimal places for penny stocks and display them rather then entering them manually?
for example – BLSP share price is 0.0052 and is rounds up and display 0.01
Thanks in advance
Hi Debbie,
I haven’t tested this, but you could try this fix:
https://stackoverflow.com/questions/21957803/is-there-a-way-i-can-import-price-from-google-finance-into-google-spreadsheet-wi
=round((googlefinance(“asx:”&A2,”marketcap”)/googlefinance(“asx:”&A2,”shares”)),4)
You could try inputting that formula in the manual price entry column — make sure to adjust the formula to refer to the correct ticker.
Hi,
Your spreadsheet seems really interesting, but some of my Canadian investments have ROC, Return of Capital, which affects its cost base. Does your spreadsheet account for this, as well as the cost of disposition when sold, and year of acquisition. These are all things the CRA wants to know. I saw earlier that you your spreadsheet does allow for stock splits, which is great.
I appreciate how hard it must be to make a spreadsheet that serves the needs of so many people in so many countries.
I would love to start using your spreadsheet and stop doing everything by paper.
Hi Ryan,
Yes, you can use the “Return of Capital” transaction type on the trade log. This will decrease the cost base of your investment.
Hi,
I am wondering is there a way to track my annual return for each year. So it’s something similar to the “monthly return” tab but do it for yearly.
Hi Vincent,
The annual returns aren’t displayed “out of the box” like the monthly returns are. However, all of the data is there on the Monthly Performance tab — see the columns to the right. The monthly returns are shown there, you can aggregate those values (by adding a new table / new formulas) to get annual returns instead.
Also, you can use the Dashboard tab in the performance section to get your performance data over any time period.
Perhaps in a future version of the tool I will also add in an “Annual Performance” tab.
I hope this helps!
An Annual Performance tab would be lovely. Watching out for it!
Hey,
Wonderful tracker:)
I would have a question. On “Portfolio holding” tab, column U, how is the “cost base” in my home currency calculated?
As an example, I buy 100 shares on 1 Jan, another 100 shares (same type) on 1 Feb.
I would assume that the cost of 100 share in my “home” currency should be calculated at the exchange rate of 1 Jan. And the cost of the next 100 shares in my home currency should be calculated at the rate from 1 Feb. Then both to be added.
But from the “Calc trade log” tab it seems to me that the “cost base” is calculated at the exch rate of the second transaction only. This way it does not really reflect the reality as I bought the currency at another exchange rate, earlier.
How do you see it? Am I missing some points?:)
Thank you
Hi Attee,
The way that you’re describing the cost base calculation is exactly what the spreadsheet is doing (at least that’s what I’m trying to make it do, haha).
Please feel free to create an example portfolio where you buy shares at two different dates. If the result is not what you’d expect, you can send to me by email and I can take a look.
Hey,
I think I was using an old version 8.1 where my home currency cost base was always calculated based on the last date.
But as I can see, you might have changed it and now in version 8.4 the cost base, calculated in my home currency, is at the exchange rate at the time of transaction:))
If that’s true and I am not mistaken… then all is good.
Yes all should be good! That was fixed a few versions ago.
what is the best way to keep informed of upcoming splits in etfs ? and does google sheets have split information built into it for every etf that i enter ?
Hi David,
Google finance / google sheets does not automatically reflect stock splits — you will need to add those split transactions on the Trade Log tab.
Usually your brokerage firm will send you updates when a stock you own splits, either by snail mail, email, or on your online statements.
Wow, thanks for this, I’ve been tracking using PWL Capital’s Rate of Return Calculator but manually entering all my balances every month. I’ve tried a few other ways to track but this seems like the cat’s ass!
Just curious about distributions from ETFs. Should I just report those as dividends? I will eventually want to track my return of capital but am just learning how that works. Apologies if this has already been asked, there’s a lot of comments on this thread!
Hi Jeff,
ETFs can give “distributions” in a few different forms. Depending on the type of distribution, there will be different impacts on the adjusted cost base of your investment / different tax consequences.
These are some good guides to understanding fund distributions:
https://www.tdassetmanagement.com/document/PDF/solutions/how_ETFs_are_taxed_en.pdf
https://www.taxtips.ca/personaltax/investing/taxtreatment/etfs.htm
This portfolio tracker allows you to enter various transaction types on the Trade Log — including dividends, return of capital, and reinvested capital gains distributions.
Thanks for that!
Hi, just wanted to check how the total dividends in the “Your Portfolio Holding” and “Dividends” sheets are calculated. It seems like fees are not taken into account.
Hi,
Great document! Thanks!
I using an older version of this document, does it mean i have to make a new copy of your latest document to include all the changes?
Also, i dont see crypto as a listed security in the Setup tab.
Can you pleae navigate?
Many thanks!
Hi VZ,
Please read through the FAQ section of this page, your questions are answered there!
Stock splits are not working for me. I entered two different stock splits for AAPL, one of 7 and one of 4. The Calculations tab shows a count of 1 instead of 2 in the Split Trx Count column.
I started with a new version of your spreadsheet and entered a few AAPL entries, and that spreadsheet works as expected.
Is there an easy way to fix my broken spreadsheet? I’ve spent two days and many hours doing data entry and hope I don’t have to start all over again.
Thanks,
Mike
Hi Mike,
Please read through the FAQ section on this page, particularly item #5.
You can copy/paste your Trade Log and Setup tabs over to the fresh sheet, no duplication of manual data entry is required.
I noticed on the “Setup” tab it says you can add ticker symbols for crypto, but when I do that it doesn’t recognize them. Example “BTC” for bitcoin, it says “NA”
Hi Daniel,
Please read through the FAQ section on this page, there’s a guide about entering crypto assets on the Setup tab.
In short, the ticker BTCUSD should work.
FYI googlefinance doesn’t have any alt-coins if you are buying/trading them. I’ve set up another google sheet with a addon called CRYPTOFINANCE with fields for alt-coins which I then use the IMPORTRANGE function to get them into this tracker
Hi Mike,
Can you give some insturctions into how you do this if it works for you?
Thanks
One thing that seems to be missing is functionality of calculating returns of shorting a stock. I noticed the returns were looking out of wack and all my shorted stocks have a cost basis of 0 in realized gains by ticker section. I believe due to the formula expecting a buy date before a sell. Any idea how to work around this?
Unfortunately this tool wasn’t built with short trades in mind. With that said, you could try this workaround:
– When you sell an investment short, the “Your Portfolio Holdings” tab will show a nil cost base, and a negative market value (e.g., selling 50 shares of AAPL at $150 per share will give you a market value of your position of -$7,500)
– When you close out the short by buying back, the tool will show that the position is closed out (no shares held)
– On the performance summary on the dashboard, it appears that everything is correctly calculated AFTER you close out the position; e.g., if you buy back your 50 shares of AAPL at $120, you’ll have an investment gain of $1,500; this will be shown on your performance chart and boosts your returns
– However, things will be wonky before you close out the short
– To give more accurate figures, I’d suggest recording both sides of the short trade (sell and buy) as soon as you initiate the trade. For example, when you initiate the short, add two transactions (buy and sell) at the exact same market price, and using the same date.
– As time goes on, you can change the price of the BUY transaction to reflect the current trading price (leaving the date constant)
– In essence, you are doing a mark-to-market on your short trade by doing this
It’s a bit of a hack, but this should work!
I hope this helps.
Hey there! Can’t tell you how much fun I’m having on a Saturday setting up all my accounts in your tracker!
Question: How would you track earnings from interest-bearing savings account? I’m starting to deposit cash into a crypto account that bears interest (like a cash savings account). At some point it’s going to pay earnings. Right now I have created a investment type called “Crypto Savings” but when the earning is posted how should I enter it? It’s not really a dividend.
Thanks!
Mike
That is the question I am also pondering.
– From one side the interes-bearing savings accounts
– from other side I also have government bonds where there is payout every half year.
Both are similar in a way that there is a payout (though for bonds I need to reinvest). I was thinking of using the dividend “action” but it would then corrupt the shares’ performance.
Hey Mike, great to hear you’re liking the tracker.
I’d track the interest received using a “dividend” transaction type on the trade log. Conceptually it’s the same thing — you’re getting a cash payout from one of your portfolio holdings. This cash received will then be factored into your performance calculations.
got it
ALso is there a way in the YOUR PORTFOLIO HOLDINGS to organize so that only non-zero (current) holdings are sorted at the top? I tried doing a sort but got alot of REF errors.
Mike
Hi Mike,
Sorting on the Portfolio Holdings tab will likely break the formulas. You can do a spreadsheet refresh if those formulas are broken — please see the FAQ item 5.
Instead, you can add a filter onto the column “Quantity of Units”, and then filter out any holdings which have 0 shares.
See here: https://zapier.com/blog/how-to-filter-in-google-sheets/
Hi,
On the tab “Trade Log”, column B, does it create an issue if the dates are NOT in increasing order?
Based on a small test, it should not be an issue. What do you think?
(Reason: inserting additional row seems to create problems).
Many thanks.
Hi Attee,
You should be able to enter dates in descending order, ascending order, or completely out of order
Hi,
When I go to run the monthly performance script it get’s halfway through my portfolio’s history and then it starts to say #N/A for my investment returns and portfolio ending values. So all the data on my portfolio stops in 2019. Is there a simple fix for this, or did I input something wrong?
Thanks
Hi Shane,
Perhaps there are some formulas that are broken in your sheet accidentally. Please try a spreadsheet refresh as mentioned in the FAQ section, item #5.
I fixed this problem by copying the formulas down on the Calc Trade Log tab. I went beyond 5000 entries.
https://docs.google.com/spreadsheets/d/e/2PACX-1vTsC2wCj5t8OMXHMuWb22r0F0FM55bs7QpbW8sAOEC1rLYIjanSWSyowT5NuwgduDJDCTY9coYc9oLW/pubhtml
Thanks Breyonna! Yes exactly, that should work.
Hi Alan
Did you receive my email re helping your followers dynamically formatting their trade data for easier importing into this tracker?
cheers
Adam
Hi,
First of all love the tracker!
I just had a question about upgrading to a new version of the sheet. When I do so, there seems to be slight changes from the old one to the new one in terms of book costs and % returns.
Any idea of why this might occur?
Thanks!
Hi Christian,
In version 8.3 of the spreadsheet, I fixed some calculations to accurately calculate the cost base for investments that were made in a foreign currency (e.g., Canadian investor buying US stocks).
Perhaps that explains the slight differences in your sheet.
I hope this helps!
Hello,
I have stocks that trade on the NEO exchange and I’m not able to get the ticker active. Is there a work around for this? Thank you.
Hi Andrew,
Hopefully google finance will add support for NEO tickers in the near future!
In the meantime, please see the FAQ section of this page for tips of using the manual price entry columns for tickers that aren’t available through google finance.
Based on FAQ, will we have to update the prices of our NEO tickers everytime we want an updated dashboard ? Is there a way to enter a formula which can capture live prices when we use the worksheet ? i have been trying to use all kinds of importxml commands, but it is not working for me.
Hi Prerit,
For stocks on the NEO exchange that can’t be found on Google Finance, you could try this formula: =IMPORTXML(“https://ycharts.com/companies/COST.NO”, “/html/body/main/div/div[2]/div/div/div[2]/div[1]/span[1]”)
In this particular case it’s using COST.NO (Costco) as the ticker. Replace as necessary.
Source: https://www.reddit.com/r/CanadianInvestor/comments/1bamm8y/how_to_import_neo_data_into_google_sheets/
Please note that I haven’t tested this myself, so I can’t speak to the accuracy of it.
Hi. Why do my portfolio Starting value in Dashboard tab showing “0”? Tahnk you
Are the Yahoo Dividend results broken for everyone or just for me? I have errors up and down the row.
How does one go entering a journaled change of stock in the trade log ? Classic Norton gambit DLR.TO -> DLR.U.TO.
Thanks in advance!
Hi, thx for the sheet!
Having an issue with the Monthly Performance Script. It runs, but the values it copies in do not match the values on the Dashboard tab (c76:i76).
Doing some sleuthing to trace back, I see a lot of “0.003” values in the monthly data which I think comes from this formula in the calculations tab =if(Calculations!D388=0,0.003,Calculations!D388)… except Calculations!D388 does NOT equal 0 – it has data.
Been at it for an hour and figured I’d post here to see if anyone else has this problem. thx again for the sheet.
If I manually do what to google script does, cycle through the months and copy Dashboard!c76:i76 values to the Monthly Performance tab, everything looks good.
Weird. Same values on my side.
Hey Carlos,
I just uploaded version 8.5 which hopefully should fix this issue.
I modified the script on the Monthly Performance tab — added code to delay the script from pasting results until everything is fully recalculated in the spreadsheet.
It seems that some other users had the same issue where the data would paste in before it was done processing.
Hopefully this helps!
Hey John,
I just uploaded version 8.5 which hopefully should fix this issue.
I modified the script on the Monthly Performance tab — added code to delay the script from pasting results until everything is fully recalculated in the spreadsheet.
It seems that some other users had the same issue where the data would paste in before it was done processing.
Hopefully this helps!
This did it! I was playing around with utilities.sleep() also but still couldn’t get it. Nice work setting up the errorCheck code. thx again!
Awesome, good to hear! Thanks for confirming
Hi, when I input a trade log on dates beyond 3 June 2021, the portfolio holdings will not take into account the new trades. I have tried inputting on a new sheet and it still does the same thing. I wonder what’s wrong?
Trades at futures dates? Peculiar.
Nah, more like I live at GMT+7 timezone, and somehow the file won’t accept any entries even though at my place it was already June 4th. So it seemed like the file has some kind of time or date referenced to a certain timezone..
Hi Ken,
If you’re entering trades that occur at a future date and you’d like to see them reflected in your portfolio, you’ll also need to adjust the date cell at the top of the Dashboard tab.
Instead of “Today”, set it to “Custom”, and then choose a date in a future — such as December 31, 2021.
I hope this helps!
Thank you! I am curious, does the Today option refer to a certain timezone?
Hi Ken,
I haven’t set a specific timezone in the spreadsheet, but it’s possible that google sheets is applying a default timezone.
I haven’t tested this myself, but perhaps if you modify the spreadsheet settings, it could help:
https://support.google.com/docs/answer/58515?co=GENIE.Platform%3DDesktop&hl=en
Hi, thank you for this amazing tool. I added my HISA account into the portfolio (of course, the spreadsheet can’t import that from google finance). As a consequence, I cannot view my HISA account in the dashboard tab. Is there a way to fix this?
Hi Chris,
Please read through the FAQ on this page — there’s discussion there about manual price entry and the $CASH method, which can be adapted for a HISA.
In short, you buy units of your HISA ticker (# of units = $ amount), and then you input a value of 1 in all of the manual price entry columns.
I hope this helps!
Does the sheet support Dodge Coin (CAD)? I can’t seem to get it to recognize.
It seems like google finance doesn’t have a ticker for dogecoin.
See here for some potential workarounds: https://www.reddit.com/r/dogecoin/comments/m8sykh/doge_on_google_sheets/
Looks like Google Finance is now listing more cryptos. Can you tell me how to properly add the following? They show up as #N/A in the Setup tab.
DOGECAD
ETHCAD
SOLCAD
XLMCAD
Hi Ryan,
It appears that while the Google Finance website supports those crypto tickers, they do not populate into google sheets. Please try the workaround mentioned in this link: https://www.reddit.com/r/CryptoCurrency/comments/sdvlqj/how_to_get_all_live_crypto_rates_in_google_sheets/
I haven’t tested it personally, but it looks helpful.
Any chance of more than 5 currencies?
I think a lot international investors easily exceed 5. Me being a Scandinavian, just Sweden, Norway, and Denmark is already 3 extra.
Thank you for the excellent portfolio tracker.
Cheers!
Hi Jan,
You’re welcome! I will keep it in mind for a future version of the spreadsheet. I do have some concerns about calculation speed, as the spreadsheet already runs a bit slowly.
Hi, Just wondering if you have a version for AUD currency and Superannuation (I think you have IRA instead?)
Hi Alan,
The spreadsheet is flexible and lets you input any currency you’d like / any account names that you’d like.
Just go to the Setup tab and add “AUD” and “Superannuation” there.
Please note that the account names are just labels, they don’t actually do anything. You can call the “IRA”, “Super”, “Test”, “Blah”, and it would function the same — it’s just a custom label.
Hi,
On my portifolio Holdings my “Quantity of Shares” never gets updated properly even after inputting new trades.
Should I so something else after adding them to my trade logs?
THanks in advance!
Got it! It looks like some transactions are missing on my side.
Hi, is there anywhere to input cash? I’d like to have cash percentage compared to investments but can’t see an option for it?
Thanks
Darren
Hey Darren,
What I do is I set $USD as a ticker symbol on the ‘Setup’ tab with USD as the currency, for example, and on the ‘Your Portfolio Holdings’ tab, on the H column (Market Value (MANUAL INPUT)) I input the value of 1. Since that’s the value of a unit of that currency. Hope that helps.
Hello, thank you for putting this together. Excellent work! How would you suggest adding tracking for transactions of physical precious metals i.e gold coins, silver bars of a variety of weights etc.? Thank you!
Seconding this. I would like to track gold (“XAUUSD”) but Google Finance does not support this and hence this spreadsheet cannot.
It would be great if we can have precious metals via data from another service.
By the way TMOAP, if you would like to get inspiration from another Google Sheet that has Precious Metals tracking you can have a peek at: https://cspersonalfinance.io/#features
Not sure how they do it, but having the same in your sheet would be amazing
Hey there, thanks a ton for this wonderful investment portfolio tracker! It really does put into bigger perspective on how we shall always allocate our funds for the maximized gain. I honestly can’t thank you enough for this. Just a suggestion, in future, would you plan to add cryptocurrency tickers into the sheets? I found https://finance.yahoo.com/quote/ to be very useful in this.
Hi, thanks for the effort you take into making this awesome tracker!
Unfortunately, I have a huge problem with your script. I can not execute it, the google blocks the script with message “This app tried to access sensitive info in your Google Account. To keep your account safe, Google blocked this access”. Do you have any idea how to resolve it?
Hi, Love this spreadsheet and effort you have out put in maintaining it.
For Dividends section, is it possible to add a chart showing Monthly Dividends comparison year over year. This will help people who are into dividend growth investing to see their dividends growth over time.
Also Dividends received so far in a column Individual Portfolio section can also be helpful..
Hi,
I want to add an irr column in my portfolio holdings, please walkthrough, if possible.
This is the best portfolio tracker spreadsheet that i have ever used….Great work friend..lots of thanks..keep it up
Hi, I realized that googlefinance doesn’t support stocks on SGX. Would there be a workaround for this?
First of all, this tracker is fantastic, thank you!! With that, I need help with something that seems minor. Under “investment categories” my “financial” part of my pie chart appears to be duplicated, is there a way to correct this? Or can you direct me to a part of the site to fix this? Thanks
I fixed this issue, I realized that I had a duplicate “financials” category. I deleted it and the issue was resolved.
You can disregard,I realized that I had a duplicate “financials” category. Thank you.
First, I wanna thank you for creating this portfolio tracker template, it is amazing. So, I started using this with the hope of merging three portfolios in one spreadsheet and then creating three additional separate portfolios in one Google sheets folder. The first one I created, the merger of all three, had no issues, I made a copy of that, and deleted what I didn’t need from the trade log. I then copy the main folder portfolio again, to make my second copy.
Here’s my dilemma, in the second copy, when I deleted the trades I didn’t need from the trade log, and then moved up the trades they were left over to the top of the spreadsheet. The data that was left did not fill in all the dashboard information, “your portfolio holdings quote, your investment “categories” etc.
If anybody can help, is there something I’m missing?
Thanks,
Dave
Hi,
When I sell mutual funds, the bank deducts 15% tax and only pays out the rest. How is it recommended to be recorded on the transaction tab? Is it better to input the actual money you receive (net) or the one before taxation (gross)? It is rather a finance question on what it makes more sense. Do you have any thoughts / suggestions?
I have been using your tracker for 2 months now, working like charm and I learnt a lot.
To be precise: deducts 15% tax on the gain (only).
Hello!
Awesome job the spreadsheet. It helps my portfolio immensely. Hope to see more features coming out soon!
I have a quick questions about how to handle spinoffs. Any advise is appreciated
How does one handle change in the stock symbol? Do you just search-replace the symbol in the trade log and setup log or do you recommend something else? Thanks
Best Googlesheets tracker I’ve seen.
You described a work around for dealing with cash – the only issue I’ve noticed is that this effectively double counts the contributions and withdrawals when you trade cash for another security. Do you have a workaround for this?
Also, is there a way to add a “Transaction Type”. I would like to add a transaction that shows cash withdrawals out of the account/portfolio?
Hi,
Excellent work on the spreadsheet, I’m using it daily and recommend it to everyone!
I have one question, is there an option to ‘Swapping’assets? This is mainly for Crypto, where you can trade ETH for BTC for example. It’s not considered a ‘sell’, since the gain wasn’t realised. Any options here? Thanks!
H!
May I know how to separate in the dashboard my investment categories into different currencies?
Thanks a lot!
Also is there a way to stop calculating currency exchange? for example I put PHP as my main currency and I put all the trade logs in PHP but the end result has always been what is the currency exchange between USD-PHP.
Fantastic portfolio tracker, thank you for putting this together. When entering a trade on the trade log, do I enter the ‘Amount per unit’ in the currency of the exchange (e.g. the Tesla share price in USD) or my local currency in GBP? Thanks.
use the currency of the exchange
Thank you
For some weird reason, when I try to run the script it hangs on a certain month range. For example, I’m trying to upload all my trades from the last few years and the script wont move passed 4/30/2018 and 5/31/2018. Any way to fix this?
Same problem! Mine is stuck with 02/26/2021-07/31/2021 even though it clearly says in my trade log my latest is 08-31-2021!!!
Hi Man,
Have you checked your spreadsheet time zone?
https://support.google.com/docs/answer/58515?hl=en-GB&co=GENIE.Platform%3DDesktop#zippy=%2Cchange-locale-and-time-zone
I had to change mine.
Please include other crypto as well (ADA, BNB, etc…)
I think he can only include cryptos that are tracked by Google Finance which I think at the moment are only BTC, ETH, LTC, and BCH.
If anyone knows otherwise please reply.
TRACKING BONDS???
Is anyone tracking U.S. treasury bonds? I’m not quite sure how to enter them into TMOAP.
TREASURY BONDS??
Is anyone tracking bonds with TMOAP? I can’t quite figure out how to enter them into the spreadsheet.
I’m checking out your spreadsheet for becoming a better (more systematic and documented) investor and have to agree: your MOAP beats everything I have seen so far.
I’m trading only infrequently (2-4 time a month).
When doing a trade I would like to record also my Target and most important my Stop threshold to calculate my Stop-Loss and tried to add this to the Tradelog tab with calculations of the $ at risk and the % of the holding at risk (at the Stop-loss threshold). Seems to work. Has anyone else requested/added such?
Best wishes, Max
I love this tool. I’ve donated 5$ and will keep doing so every year as long as I use it.
I’d suggest netting the withdrawals and contributions per month. Considering that they are estimated using the trade log, they will necessarily be inaccurate, and the net value will give a result that is usually closer to reality. This is especially true for more frequent traders.
In my case, I always end up with ludicrous amounts in withdrawals and contributions every month.
Thank you for your great work
Also the Cost Basis in “Your Portfolio Holdings” returns 0 for short positions.
Im sorry but what do you mean by netting the withdrawals and contributions?
If you sell $10k worth of stocks, then buy $10k worth of stocks, the performance reporting will show a $10k withdrawal and a $10k contribution… this makes the “Change in Portfolio $ Value” chart look messy. Steam1901’s suggestion is that those are combined (i.e. no contribution or withdrawal) to reduce noise in the chart.
Very informative tool. I keep using it.
About “realized gains are calculated using the average cost base methodology,” are there other options like specified lots to calculate realized gains?
Thanks
I find it weird that I did not do any withdrawals from my account per se but it logs the selling as withdrawals. Any turnaround on this? I just reinvest again the profit so why does it not take that into account
I am getting a weird error originating from the Dashboard tab. Basically, why is the ‘Portfolio ending value’ of a month, not the same as the ‘Portfolio starting value’ of the next month in the ‘Monthly Performance’ tab? Since this data (in N-T columns) gets copied from the Dashboard tab, I see the same issue there.
I was having the same issue. The cause is any tickers that cannot pull the price from Google Finance, where you have manually input the price in columns AF & AL in the ‘your portfolio holdings’ tab.
The Monthly Performance script and calculation will not work if you have any manual entered prices, because it’s grabbing different values for the start date & end date of each month, causing incorrect monthly investment returns.
I couldn’t think of an easy fix, you would probably need to have a table to input each months ending price for each of those tickers… and then change the script/calculation tab to account for those cases.
I see 2 issues on my data.
1) Once the script runs and calculates for the 43 months based on the current data, I added additional data, the script does not pick up the additional data and recalculate.
2) Monthly ending value is not the same as starting value for the next month.
3) The corresponding graph also is not updated.
I have tried creating a new spreadsheet with my data and these issues persist.
Did anyone have similar issues ?
Hi, Thank you for your work on the spreadsheet, it’s a wonderful tool.
I have a query about the trading fees. It seems like if you enter a purchase, for example, 0.5 shares at a price of $100 with trading fees of $1 then in the “portfolio holdings” tab the cost base comes up as $102. In particular, it doubles the trading fees. Similarly, if you enter a purchase of for example 0.33 shares at a price of $100 with trading fees are $1 then in the “portfolio holdings” tab the cost base comes up as $103, and so triples the trading fees.
Is there a way to correct this as it means every fractional share price is giving an incorrect cost base? Really appreciate the help.
Has anyone figured out a way to add SECTORS to this spreadsheet? I want to track by sector to balance out my portfolio. Thanks!
Hi,
Great work.
I have a suggestion. I like how you can use the account filter in the dashboard to essentially select and see the net performance of all your portfolio’s (Investment Accounts) or a single one. However it would be good if could select more than one but not neccessarily all.
I currently have 4 different ones and i would like to see the consolidated performance of three of them. It could perhaps be set up like the the check boxes you get in an excel filter.
Have set you a well deserved coffee. Cheers
Hi,
It is a great tool which many international investors, like me, looking for a suitable tool to track our investment.
As a near retire person who aims at invest internationally and wishes to have a systematic way to manage my investment like an asset manager, the tool still has some area of improvement as follows:
1) It is better to have 10 or more currencies
2) The price in foreign currencies (current, buy, sell) should be keeping track by both local and foreign currencies such that we can understand the profit/loss when putting exchange rate factors into account.
3) For category, it is better to include more items and allow sub-category, such as REIT > Logistic, Finacial > Bank
I understand this is a bit demanding but it would make the tool perfect for those who need it to make their life better.
Hi
Is there any way the dividends tab can be stretched out for more than 5 years? especially the last 24 months tab
Hi,
Great spreadsheet!
Is there a way to track the annual rate of return of individual stocks (where I have made multiple trades for that stock in a period of time) in this spreadsheet?
Thanks!
Script execution issue here.
I can’t get passed this error, even after numerous reload sheet/GO. v8.5. It actually used to work for me as of 2 mo ago:
“Exceeded maximum execution time”
Has anyone seen this and know of a workaround?
I’m having same issue. I’m on my 2nd attempt at upgrading to 8.5 as my 8.4 stopped working. I’m re-inputting info very carefully and slowly and just tried to run the monthly performance after only entering in history for 1 stock this time and still getting same error after repeated refreshes.
8.5 will not go past 10% complete. 8.4 stopped working. sigh. I will miss this sheet. It was really great while it lasted.
I have spotted and found a solution to an error in this spreadsheet,
I found that in row 78 in the ‘dashboard’, the annualised and non annualised returns would not change to the correct output when I manually changed the start and end date to see my portfolio performance.
To correct this, go to ‘calculation’ E2219 and enter the following instead – ‘=if(E2204<365,"Yes","No")'
This should correct the error because I believe that the returns were previously linked to the average holding period as opposed to the days in selected range.
Thanks again!
Can you share steps to update as you suggested?
Hi love the spread sheet but i am having a problem getting the fractional shares to show up right in the your portfolio holdings.I have tried to move the decimal point still wont show up any ideas to correct this would be great.
Hello,
I think it would be helpful to distinguish between true “contributions” (new cash that is added into the portfolio from external sources) vs. reinvesting the dividends collected.
It would help to see the compounding effect in the overall portfolio value growth and have a clear picture of what funds have truly been added to grow the portfolio.
Other than that, really amazing job!
I have a problem with the monthly performance tab. The script works for the first month or so but then it stops working. Also, the ending value of the portfolio will not bring forward to the start value of the next month, which keeps at zero.
There is no problem at first, but after filling in the stock transaction from the 214 grid of “Trade log”, there is no corresponding stock number and average cost in “Portofolio Holdings”?
How to deal with this problem? Thank you very much
Anyone know if MEASURE OF A PLAN is ever coming back? Haven’t seen a response to the comments in months.
GOOGLEFINANCE does not work with some stock markets (Romanian Stock Market – bvb.ro is one of them, as of october 2021), but instead you can watch this video for the best workaround I ever found:
https://www.youtube.com/watch?v=kn1JonQIvdI
In a nutshell, the method uses the formula IMPORTHTML, which gathers all the ticker details from the webpage.
I’m trying to use the tracker, is this something you have to pay for? I am not sure how to use this and for some reason I do not have access when downloading to my google sheets.
It’s free.
You have to save a copy on your google account.
Would it be an option for future versions to include Total Expense Ratios of the ETFs that are included in the portfolio? Would be interesting to have the full picture of costs associated with your current ETFs.
Now I’m doing this by having a manually added sheet with basic calculations, but can imagine it would be more interesting if there is a small overview where you fill out the different TER’s and get some more insights on it.
When I run the script in the ‘Performance’ tab, I get a message saying “Exception: Range not found”
Anyone know what the problem is here?
Thanks
Out of curiosity, is it possible to add more than 10 accounts?
I’ve done it myself, but you need basic understanding of Google Sheets. You need to do modifications in several places.
Same question as Jules above. This tool seems perfect for me but I have 16 accounts that I need to track. Any way to add more than 10 accounts? Thanks and keep up the great job!
Thank you for creating this brilliant spreadsheet
The Monthly Performance script is blocked by Google. I tried several times, even change my Gmail privacy setting, still can’t get through it.
Could you please help to provide some solution?
Thank you!
Hi
I am from a country not tracked by google finance, how do i track of my historical performance
When I run the script on the Monthly Performance tab it just runs and runs and then shows a error messages stating “Exceeded maximum execution time” ?? Is there a fix for this?
There is a timeout value of 3000ms somewhere in the script (see Extensions > Apps Script). Change this to 5000ms and run the calculation again.
Thank you for the amazing tracker, one of the best trackers available online.
I have a question on how the contribution amount and starting value are calculated in the dashboard? It’s not adding any contribution made on the start date to the contribution column. Contributions made on the start date are being added to the portfolio starting value.
Shouldn’t portfolio starting value be ending balance of (start date minus 1 day) and contribution made on the start date should be part of the contribution column for that period.
For example: In the dashboard, if I give the start date as 10/01/2021 and the end date as 10/31/2021, contributions made on 10/01/2021 are not included in the contribution amount. It’s being added to the starting value.
I was expecting starting value to be balance as of 09/30/2021. Contributions made between 10/01 thru 10/31 to be included in the contribution column and portfolio ending value be balance as of 09/30/2021.
Please share your thoughts!
Thanks again for the great easy-to-use tracker.
Thank you for putting this together. Better than any tracker I’ve created for myself or came across.
Hello,
TQQQ split recently. I inputted the event in trade log successfully and the current state is correct.
However, Porftolio holdings using custom date is wrong : the price displayd is adjusted for the split even before it happened.
I suspect the monthly performance might also be wrong since if it uses the same inputs/formula.
For some reason, BTCUSD does not pull up Bitcoin on the sheet. It says ‘n/a’ — help?
ps: this is awesome, thank you!
How do I import an existing portfolio into this? I understand I have to manually input each stock. But because I’ve purchased 40+ stocks and have dollar cost averaged everything up to this point, how do I input the value of each holding?
Disregard. Figured it out.
Thank you for this amazing tool. I have the following question. If you own a company that makes a spinout company and distributes to the shareholders shares of the latter, how do you register this “transaction” in the tracker? Because the total amount is zero, since you have not paid for the new shares.
Thank you in advance.
The tracker doesn’t have this functionality, but below is my work-around when tickers change (for example, when RDS.B recently became SHEL), which may not be exactly what you are asking:
I run the “Monthly Performance” calculator, then do find & replace all references to the old stock with the new stock. This keeps the unrealized gain/loss true.
The only issues is that if you delete the Monthly Performance tab and re-calculate, there will be inaccuracies prior to the new ticker because the “new stock” didn’t exist in the history.
Hi, I’m trying to add some crypto assets to the tracker but BTCUSD is not pulling the name of stock. Anyone has figured out how to add crypto correctly? Thank you
check out https://www.youtube.com/watch?v=1bl6dSinoxI and it has a goole sheet you can download or just copy over the formulas for grabbing most coin prices
Hi, what would be the best way to log/track regular monthly broker fees? Not tied to a particular trade or stock. Thanks!
I have never done this but if I had monthly fees, I would create a dummy stock called MONTHLY-FEES or something like that.
Every month, create a $0 buy for 0 shares of MONTHLY-FEES, with Trading Fees equal to your fees.
You may need to make a one-time entry to ‘buy’ 1 share @ $0, and another to ‘sell’ 1 share @ $0 so that the share shows up in the Realized Gains/Loss section to be calculated in the Monthly Performance tab (I’m not 100% if this is necessary).
And what is the expected way to track taxes when receiving a dividend? (Foreign withholding tax for example, when a Canadian receives a US dividend). Thanks!
Does the sheet show total gain or loss with dividend payments factored in? I can’t seem to find it.
For example if price of stock ABC is down $500 but you’ve received $600 in lifetime dividend payments from stock ABC, you are still up $100 for a total gain of 20%
That is built into the “Monthly Performance” tab calculator (but not specific by individual holding).
You can see both total dividends received and unrealized loss/gain on the “Your Portfolio Holdings” and could insert a column to calculate that if you wanted.
thanks man.
i think i will try to insert a column for that.
=((market value + dividends)-cost basis)/cost basis
Can I use this for multi-investor situation? Can it work If there are friends that contribute different amounts. at different times?
I don’t understand why you’d want to do that, but you could set up each individual as a separate account.
Note that the tracker isn’t aware of “cash held in account” (when you sell a stock, the tracker considers that money to be withdrawn from your portfolio), so if you are all pooling money to buy stocks, it would be tough to track.
is there a better way to sort positions by size in “your portfolio holdings” tab. Showing too many zero positions by the default alphabetical sorting. The graphical “dashboard” becomes useless ones a bunch of smaller positions are added.
I move all my “zero position” holdings to the very bottom of my SETUP tab to separate them from my active holdings… this makes the “Your Portfolio Holdings” much less cluttered with old stuff… it also makes the “Realized Gains” tab easier to read.
Much easier to use new(ish) Sheets feature: “Slicers” (under ‘Data’ menu).
Slicers are like permanent filter views. Different kinds of conditions can be applied, depending on data type. Usefully, they can be used to set a default view.
In this case, I have one created that applies to the ‘Units Held’ column w/ default set after choosing ‘Select All’ then unticking ‘0’. That way, only current holdings are shown.
I’ve found slicers super-useful on the ‘Trade Log’ sheet for tracking down entry errors. With slicers for each of Ticker, Accnt, Trans Type, etc. it’s easy to filter against multiple criteria and chase down reconciliation errors, e.g., transactions attributed to wrong account.
Note that once slicers are applied to an overlapping data range, you can’t edit the range for any of them. So, e.g., if your data expands beyond the original # of rows, you’ll need to delete all but one, edit that and recreate the others. So it’s good practice to add any future-proofing rows before setting up the first slicer.
Is it possible to make the charts interactive? I would like to embed them on to my website.
How do we copy and paste cells? I’m trying to copy from the “Trade Log” sheet, from Rows 6 and downwards. But when I paste into another Google spreadsheet (or into a blank, brand-new copy of the same Investment Portfolio Tracker spreadsheet) nothing happens. I’ve even tried A) Paste Special — Values Only
B) Paste Special — Formula Only
C) Paste Special — Format Only
I figured out the problem. Firefox can’t do it. But when I tried to copy-paste in Chrome, it worked.
when determining when to use the annualized or non-annualized money rate of return, why is the average buy/sell date used rather than the gross buy/sell date?
when entering a time period greater than 1 year, the non-annualized return is displayed. This is due to the average buy/sell being less than 1 year.
Hi,
Great spreadsheet! is there a way to capture stock dividends and not just cash dividends?
You just need to create two different lines on the Trade Log. The first is for the cash dividend, then the 2nd should be a ‘Buy’ of the # of shares the DRIP provided, making sure not add the transaction fee, if applicable.
I’m trying to add a U.UK stock (LOND:BRH). The LSE is in GBX, so when entering the info on the trade tab correctly, the calulation for my cost base shows as 0.61p when in fact it’s 61p. Why is this the case?
Sorry, U.K stock * LON:BRH *
LON:KNB, April 8th 2022 @14:06 = £0.0602 / 6.02gbx.
On the tab ‘Your Portfolio Holdings’ for this ticker, cell G ‘Market Value Google Finance’ shows the ticker price as ‘6.2’. However, the cost price I have entered on tab ‘Trade Log’ is £0.217102. This is showing an unrealised gain as 26663%, when it should be – 72% negative.
How do I reflect the UK price of £0.00 / 000gbx so they’re accurate?
What a fantastic worksheet.
I did have one question. It looks like there are 4000 lines available in the trade log for inputting each transaction. While this seems like a lot at the setup of the sheet, is there a method you recommend to add more lines to the trade log, or do you have another suggestion?
I tend to do a lot of small fraction transactions (now Wealthsimple has zero commission trades) so would see me getting through those 4000 lines within a few years
Really appreciate your help – will be buying you a coffee!
Hi, great worksheet. Quick question, I’m trying to figure out how to handle the ATT/WBD reorganization and having trouble figuring it out. How do we handle this in the spreadsheet?
THanks!
I just added a buy for the WBD with a cost basis of Zero
Hello,
How do we enter in Mergers? Like I had 40 shares of one stock before the merger and then have 4 shares of a different stock after the merger.
I ended up doing a sale of the old stock and then buy of the new stock to account for it. Not sure if that is the best way. If anyone else did something different I would be interested to know.
On the dashboard page, can you make a graph/display to show Performance by Account as well? Just like we have a performance by Investment Categories?
The use case is if I am running some strategy-driven investments in a specific account, this will help see the performance for the given strategy.
Not sure if you figured it out, but my guess would be to copy/paste the same table from “Calculations” tab I367:AG2208 elsewhere (ie “account performance” tab starting in cell A1) and change the first cell (ie A1) to:
=TRANSPOSE(Setup!$B$39:$B36)
You’d also need to copy/paste the “Monthly Weighted Return” calculations (starting at B387-G) and change col G to pull the account data instead of category.
Then you’d be able to generate the similar table and chart on the Dashboard tab based on your new calculations.
I’ve just used filter function and/or query to pull data from the log tab and reference the start/end date cells within the formula.
On the trade log page, why can we only select stocks in the set-up page? I find this rather inconvenient when trying to enter trades from 5 years ago – some companies no longer exists. Will it affect anything else if I enter items onto the trade log without having a match on the set up page?
Is there a way to increase the stock list more than 250 ?
Did you ever figure it out. I just hit the limit.
The challenge is that the 250 range is hard-coded in some formulae in other sheets. IIRC, Trade Calc has some lookup functions that refer to a range like “Setup!’B52:B302”. You need to go chase those down and edit them to the expanded range. (I think it’s possible to leave it open-eneded, e.g., “B52:B”, but there might be some reason why it’s bounded–maybe lookups have to be?)
Trying to add Cardano (ADA) to GBP and it doesn’t find it on Google Finance, however here is link to the crypto pair on google finance;
https://www.google.com/finance/quote/ADA-GBP?hl=en
It works for BTCGBP and ETHGBP.
Any tips for ADAGBP?
Can we add Doge Coin ?
I have a question on the stock split. Does it take the end of date price for the stock split? For example with the recent split of AMZN – the split was effective with price on close of business on June 3 and the trading with the new split price began on June the 6. Should I enter split on June 3 or June 6 in the spreadsheet?
Is it possible to move shares from account A to B without a pair of Sell/Buy (which would trigger realized gains/losses)?
It’s rare but over the years I’ve moved my portfolio between brokers a few times.
Since Amazon split, the spreadsheed is not loading correctly the price for any previous date. It works fine for “today()”, but if I try to load any old date, it shows market price as “0”. Besides entering the price manually, is there any workaround?
For info, changing the ticker from “AMZN” to “NASDAQ:AMZN” did the trick.
I love using this spreadsheet to track my GME, and now that the stock split dividend date is set, I´m wondering how to enter it to the trade log.
I see there is a workaround for stock dividends as opposed to cash dividends, using two lines. But that still misses the split part.
When calculating the cost base using a different currency, does it account for every individual buy dates having different currency rate, or just use todays rate?
WHY IS THE SHEET RESTRICTED TO 5 CURRENCIES?
This is great, but I really want a feature, in the Portfolio, want to have a new tab for Inventment account, under Portfolio holdings, add an account column.
I really want to track performance from each account, and view total assets for each account. Much appreciated!
I have to use categories as my accounts, I find this works. Put VOO under different categories(my accounts) is ok.
Great job.
Hi, if I write “BTCCAD” and “ETHCAD” in my holdings its working but not “ADACAD” for Cardano and “SOLCAD” for Solana.
Do you know why? ADACAD exists on Google Finance
How do you recommend we track selling specific tax lots and keeping our losses/gains and average price accurate? For Tax Loss Harvesting on specific stocks etc and/or for Rebalancing on Asset Allocation Thanks.
Hey, I’m getting this error when trying to access the spreadsheet: “We’re sorry. You can’t access this item because it is in violation of our Terms of Service.”
Hi! I was trying to access the spreadsheet as I was told it was a great tool to track investment, but I am unable to do so. Is it possible to get a copy of the sheet? Many thanks, Nadia.
I’ve been loving your spreadsheet and can’t access it again like the people above. I need a fresh copy, because I’ve encountered an error in the version I’m using.
Let us know how we can help. Happy to donate some money for the efforts!
Hi Ron, I’ve uploaded a new version 8.6 (and updated the links in the post to refer to that new version). It is simply a copy of the previous version 8.5. For the life of me I can’t figure out why Google flagged it as violating terms of service, as the sheet does not contain anything malicious / suspicious. I will continue to investigate.
Donations are a big help, but certainly not required!
Hi Nadia,
I’ve uploaded a new version 8.6 (and updated the links in the post to refer to that new version). It is simply a copy of the previous version 8.5. For the life of me I can’t figure out why Google flagged it as violating terms of service, as the sheet does not contain anything malicious / suspicious. I will continue to investigate.
It could be that someone flagged it from the menu “Help > Report abuse”.
Maybe someone who’s jealous of your great contribution to the financial community
Is there an alternate download location/format that we can get the spreadsheet from
Is there an alternate download location/format that we can access?
Thank you
we can’t copy last version 8.5 it gives us “We’re sorry. You can’t access this item because it is in violation of our Terms of Service.”
Hi Sam,
I’ve uploaded a new version 8.6 (and updated the links in the post to refer to that new version). It is simply a copy of the previous version 8.5. For the life of me I can’t figure out why Google flagged it as violating terms of service, as the sheet does not contain anything malicious / suspicious. I will continue to investigate.
The sheet is no longer available on Google: is there another place where I can find it?
Many thanks.
Has development/support stopped on this?
For all that can’t access with the link above. Try using the following link. It contains all tools and versions:
https://drive.google.com/drive/u/1/folders/1sU7n4TmQk2oLhOMIlwmxepMjNRLx3Vyk
Thank you David — very helpful and much appreciated.
FYI — I’ve uploaded a new version 8.6 (and updated the links in the post to refer to that new version). It is simply a copy of the previous version 8.5. For the life of me I can’t figure out why Google flagged it as violating terms of service, as the sheet does not contain anything malicious / suspicious. I will continue to investigate.
Hi, nice to see you around here once again.
I have an issue with the “Realized gains” for stocks that have split during the year. For example, early in the year I closed my position in SHOP, and then I rebought again a few times until the stock did a 10:1 split in June 2022.
If I select the full year in the Realized Gains tab, the Realized gains are extremely high because it’s using a “Cost Base” post-split (Actual “Cost Base” / 10), but an “Sale Price” pre-split. This is obviously incorrect and it’s messing up with the Realized Gains. I can modify the formula manually to get the correct number, but I think it was worth mentioning.
My spreadsheet doesn’t seem to calculate the US: CANADIAN exchange properly. I have everything set up accordingly. For example, my cost base vs market value is wildly different from the section YOUR PORTFOLIO HOLDINGS in “Local currency (not converted)” vs “In Cad Currency” sections.
To elaborate. It’s calculating the market value correctly by the exchange rate correctly (currently at 1.376), but the cost base is not correlating correctly at all.
To give you an example. My AAPL stock has a current “In Local Currency (not converted)” cost base of $96.50 US. The “In CAD Currency ($)” cost base is $123.76. The correct cost base should be $132.78.
This is true for all my US holdings. The market values correlate fine, but the cost base is different.
Is there any way to fix this?
I noticed this discrepancy vs my brokerage book cost. I believe it is because the spreadsheet uses historical forex rates (i.e., the rate on the day of purchase), whereas the bank displays the CAD value of foreign-denominated securities according to the current rate. Which you prefer depends on your interest: what was my actual cost (historical rate) vs what is this worth today (present rate)?
Given the volatility of CAD/USD this year, it’s thrown the spreadsheet off from my account by an appreciable bit.
Btw, CRA guidelines allow you to calc your cost base either way, so long as you are consistent.
How would I go about tracking a journaled stock? For example Journaling 100 shares of DLR.TO – DLR.U.TO
Hi,
Possible to record scrip dividend
Receiving extra shares at zero cost.
Thanks
Hi,
Quick question on how realized gains are calculated. The spreadsheet seems to do the calculation based on stock purchased cost if owned in multiple accounts but sold in one account. For example if there is an RRSP and a TFSA, both with BCE shares. If BCE shares sold within the TFSA only, the Cost Base is calculated based on both the RRSP and TFSA values. Am I interpreting this correctly?
Thanks.
Yes Mark I believe you are calculating this correctly. The cost base is not calculated separately account by account. Eg. you purchase 1 stock in tfsa, 1 stock in rrsp, 1 stock in unregistered account, your cost average is a combination of all 3.
If you select the account in the dashboard you will get the correct cost base.
Hi,
I would like to use the template with Eurpean formatting (date, currency, etc), but when I change something, the program no longer responds.
Is there a way to correct this?
Thank You in advance
Hi,
Please ignore my previous mail. The problem is solved since I am using the new version on Google.
I have positions with BMPS from beginning of 2022. On September they made a reverse split of 1:100.
After the split, I purchase more shares. Is it possible to identify the older shares before the split from the new ones after the split?
If I leave the original values, the calculations are completely wrong.
Thank You in advance for your support
Kind Regards
Hi Francesco,
On the date of the reverse split, please add a Split transaction the trade log, with a split ratio of 0.01 (reflecting 1 new share for each 100 old shares).
This will adjust the old shares so that it is comparable to the new buys that you are making.
See the FAQ section of this page for more details.
Hi can you post your methotology and ways that you used to calculate your time weighted return and money weighted return ? I can’t seem to get the same answers.
Hi Zheng,
For money-weighted and time-weighted returns, these are the methodologies:
https://www.investopedia.com/terms/m/money-weighted-return.asp
https://www.investopedia.com/terms/t/time-weightedror.asp
The money-weighted return is calculated in the spreadsheet on the “Calculations” tab (see rows 2202 to 2220).
The time-weighted return is calculated on the “Monthly Performance” tab, using the monthly return calculated in each period.
[…] once you’re up and running, you can use this investment portfolio tracking spreadsheet for a neat and tidy way to keep tabs on your […]
How does one input a short sale of an equit? I only see buy and sell options. There is no “sell short”.
Hi,
I apologize in advance if this was already asked. How would I input a corporate action like the one of Brookfield where I received shares of BN.TO and BAM.TO for shares of BAM-A.TO? I have input them as buy/sell transactions for the time being.
Thank You
Canadian stocks like TD.TO, google finance cannot retrive price, anyone asked this question before?
For GoogleFinance formulas, Canadian stocks have to be in this format:
TSE:TD
Exactly. Thank you Mark!
Has anyone figured out the new issue with “.UN” stocks?
For example, TSE:KEG.un worked up until the last week but now I can’t figure out how to get it to pull data.
Another holding I have (previously TSE:HOT.un) works when changed to TSE:HOT.U but that doesn’t work work with my other “.un” stocks.
Hi, Is there any way for the spreadsheet to handle ‘Transfer in Kind’ from one account to another? For example moving 100 shares of RY from a RIF account to TFSA.
Thanks
Hi Mark, there isn’t a way to do this directly in the spreadsheet.
You could input a sell transaction from the RIF and a buy transaction in the TFSA on the same day.
Alternatively, you could simply re-label the initial buy transaction to reflect the account where that investment resides now.
For example, if I bought 100 shares of RY on June-30-2022 in my RIF, then transferred to a TFSA later on, you could change the initial transaction to be within the TFSA instead.
Footnote: depending on the accounts used, transferring securities can trigger ‘deemed dispositions’ for tax purposes.
So, for example, when moving a stock w/ share price gains from non-reg’d to reg’d accnt, you don’t get to “import” the gains into the tax shelter; CRA will consider you to have sold at market price, realized taxable investment gains and deposited the security into reg’d account at that new cost base.
Is there a way to also add interest income ? The cash I have in my accounts generate a substantial amount of income as well.
Hi Popo,
See the FAQ section of this page, particularly item #7.
You can track cash positions in this way.
Hi, I am getting an error on the monthly performance. Says “Exception: Range not found”.
Any idea?
fixed. I made a typo on the trade log.
Thanks for confirming Priyank. Happy tracking!
THANK YOU so much for your awesome budgeting and investment tracker excel/google templates first off!
Question… Setup/trade log work flawlessly and display proper data. The issue I am having is that the Total amount(before trading fees at 0%) do not match the “Dashboard” tab’s data. For example $57,449.91 is accurately displayed in trade log, but in the dashboard this same figure is displayed as $77,133.00. Not sure exactly what is happening and how to remedy this. Thanks.
Hi Dave,
Please check the currency used at the top of the Dashboard tab. Perhaps the investment you made is in USD, but the Dashboard is calculating the values in CAD (Canadian dollars) instead?
If so, just switch the Dashboard tab to USD and it will display correctly afterwards.
What a silly mistake, that did the trick. Thanks again.
Hi, is there any recommended way of inputting positions in GICs? Would you code them as $CASH positions like in your example? Thanks!
Hi Jay — yes exactly, I would use the $CASH method for GICs (you could use a ticker of $GIC for example).
I don’t know what’s wrong with my spreadsheet, but under “Portfolio Holdings” there are figures for stocks even though I haven’t entered any trades for them yet..
Been using this spreadsheet for a couple of years and been super helpful!
One issue that is preventing me from continue using it is using funds e.g. vanguard 100% lifestrategy fund.
Is there any way to incorporate this / deal with it as I really love this sheet.
Why is it only possible to manage 5 currencies? Or is there a way to insert more?
Hey there,
I’m getting a notification that the script for “getHistoricalPerformance” could no longer be found on the “monthly performance” tab. It was working about two weeks ago.
If you don’t mind digging in on your end that would amazingly helpful.
Thank you so much for this tool.
Alan resolved this.Turns out it wasn’t anything but a fix on Google’s end.
Some ETF’s are returning N/A. Been like this for a week now.
More precisely SXR8 (XETRA exchange) and CSPX (London exchange)
Do you know why it doesnt work? It is live on Google FInance website with the correct ticker?
Issue on the Google Side:
https://issuetracker.google.com/issues/282426429
Did you try entering the entire stock name? For example when i’m in Canada I need to use TSE:BNS
This is truly a masterpiece. I’m trying to figure out a workaround for VTWAX, since it has two categories (US & Foreign Equity). I can pull this from Vanguard’s website, but how can this be accurately captured specifically in the Dashboard? It doesn’t really make sense for it to be it’s own category.
Secondly, the Monthly Performance tab, columns N-F don’t populate. I’ve entered all my historical data in the trade log, but it isn’t captured here. Please help!
Hi,
Thanks for the spreadsheet. It seems like the dividends are not taken into account in the returns calculations. Is that correct?
Thanks.
Hi Julian,
Dividends are taken into consideration when computing your portfolio return.
Hello!
The Monthly Performance script repeatedly exceeds the maximum execution time. I have run it about 50 times now and it has only populated 3 months of data (out of 147). When I run the script through Apps Script it shows “Performance Calc Error is still active” every 4 seconds. Is it supposed to take this much time, or is there something I have input incorrectly? Thanks!
I am having the same issue and sometimes get different results with the same data. Hopefully the developer will notice our questions
Love this spreadsheet, but having trouble getting the spreadsheet to recognize 2 of my holdings, Fortis ticker FTS, and Granite Real Estate Investment Trust ticker GRT.UN. Any ideas to get the spreadsheet to recognize these holdings. Thanks in advance.
First of all – great tool, just starting using it.
Got a question, what would be the best way of adding de-listed stocks and their dividends. I.e., had some BPY.UN REIT in CAD, it was then delisted from TSX and obtained cash + BAM + BPYP.
There was a lot of confusion steps in between. Since I cannot add delisted stocks how should I do it in order to properly track it all? Thanks
Hey just started using your spreadsheet and still figuring it out.
I have Fortis on the TSE. Ticker FTS.
I have put it in the stop page as TSE:FTS, checked the google finance page and that would be the correct entry but nothing shows up.
There is another one that doesn’t show up but Google isn’t recognizing stocks on the TSE with “.UN” in my case CAR.UN is a REIT. But that is a google problem not a glitch in your googlesheet.
Thanks for the help Steve Hogg
Sorry I didn’t proof read, setup not stop on the third line.
There seems to be many issues this month with Google Finance tickers not working properly (https://issuetracker.google.com/issues/284822200).
I’m wondering if there’s a way to import data from Yahoo Finance if the GOOGLEFINANCE function stops working…
Hi Steve, I have the same problem with both FTS and anything that has the .UN in my reits. Not sure what the problem is here either, but we’re in the same boat!
Hey folsk, I was able to get a not very-so-stable formula running and get the from Yahoo Finance data.
I added this small script to read the CSV from their API
__ const GETCSV = url => Utilities.parseCsv(UrlFetchApp.fetch(url).getContentText()); __
And then added the values into the “Manual Input” cells in purple in this file
https://docs.google.com/spreadsheets/d/1GxI5aj2eKkPbMe4xxgVwNgvbtNxEfB7T2Tuxtzi3DLg/edit#gid=1111357939
Keep in mind it’s not perfect. I’m having some issues with the dates. It seems the calculation doesn’t return always a value (e.g holidays and weekend) but I couldn’t figure out why.
Maybe someone smarter than me can connect the dots.
Hope it helps
Hello
I would like to ask a question. Recently, there have been wrong data on the market value of different holdings every day. What is the problem?
Thank you for your reply
Hello,
Thank you so much for providing this form for everyone.
How do I include the CD interest rate in the form?
I had JNJ stocks and I change to KNVUE stock. How can I manage this?
Thanks
Looking for some clarification about the rate of return calculations as they relate to DRIPs.
Considering we add additional shares as ‘buy’ in the Trade Log, it’s essentially considering those amounts as returns (the total dividend) as well as contributions (the fee-less shares acquired with the dividends).
For all I know this is standard practice in the calculation of RoR, but I find it confusing if I want to see what my overall monetary investment (contribution) to my portfolio has been.
Hi Steve
I have exhausted all 250 rows in setup , how do I add more.
[…] INVESTMENT PORTFOLIO TRACKER DI THE MEASURE OF A PLAN […]
Thank you for sharing this. My account has some foreign taxes and annual fees. How do I handle that in the portfolio tracker? Typically my advisor sells shares to cover the cost
Dear Steve,
I have been using the Google sheet from quite sometime .I have exhausted all 250 columns in setup for tickets and would like to add more .How do I do it
Amit
Hello,
Would it be possible to get a dividend bar added to the bar chart on the Change in Portfolio Value table on the Dashboard?
The number is in the table, just no actual bar.
Hi,
Firs of all, I would like to thank you for this great spreadsheet. Thanks for sharing with everyone at free of cost.
I own LAC before it gets split in to LAC and LAC. Now my portfolio is imbalance due to this. How can I handle this in the spreadsheet. Kindly guid me. Thank you.
The spreadsheet is great, but I wish it could handle more types of investments. Good start to include ETF’s and Crypto, but what about precious metals like gold or silver. The market values are freely available on Google Finance, why not make them available as an investment class. People want to be diversified across multiple asset classes, not just stocks. Therefore the sheet has limited value for me presently.
Thanks so much for sharing this google sheet, it is the best and even better than the paid software.
I have 1 request, would you enhance it to support writing short call/put? I try to record those trade as sell to open then later a buy to close, but that would make the option’s holding qty being wrong. Thanks.
really hope can support 20 accounts as I want to these: TD RESP, TD TFSA, TD RRSP, questrade RESP, questrade TFSA, IB cash, TD cash, …, need more than 10 accounts
Thank you for creating and maintaining this spreadsheet, this is incredibly useful and extremely well done!
One feature I would love to see implemented is the expense ratio (ER) for my index funds (ETF and/or mutual funds). There is a fee in the trade log but it looks to be a one time for the trade, not a percentage ER of the ticker owned by an index fund.
Another piece of information that would be nice is the tax burden (unrealized gains) on tax-deferred accounts and brokerage accounts. This tax liability could then be copied into a net worth statement.
Thanks for the hard work!
Hello,
One suggestion that would help with my use case is being able to specify the owner of the transaction (myself, spouse, or joint). Retirement accounts are “individual”, but when building a portfolio, our household groups our holding when it comes to asset allocation and location.
It would be convenient though to know how the portfolio is spread amongst the individual owners.
How would you log a spin off?
Ex. BAM.A.TO was converted to BN.TO, but I was given a ‘spin off’ of BAM.TO
111 Shares of BAM.A.TO
Were converted to 111 Shares of BN.TO and 27 Shares of BAM.TO
For the Canadian Market, I managed to get the spreadsheet working with values from Yahoo Finance Canada.
In the Setup tab, for the name of the Stock, replace with
And for the Valid check replace with
On the Portfolio Holdings tab, for the Market Value (from Google Finance) column, replace with
In the Apps Script page, add the cheeriogs library using the Script ID: 1ReeQ6WO8kKNxoaA_O0XEQ589cIrRvEBA9qcWpNqdOP17i47u6N9M5Xh0
then add the following functions:
function yahooF(ticker) {
const url = `https://ca.finance.yahoo.com/quote/${ticker}?p=${ticker}`;
const res = UrlFetchApp.fetch(url, {muteHttpExceptions: true});
const contentText = res.getContentText();
const price = contentText.match(/(\d+[,]?[\d\.]+?)/); console.log(price[1]); return price[1];
}
function yahooFname(ticker) {
const url = `https://ca.finance.yahoo.com/quote/${ticker}?p=${ticker}`;
const res = UrlFetchApp.fetch(url, {muteHttpExceptions: true});
const contentText = res.getContentText();
const $ = Cheerio.load(contentText);
const companyName = $(‘h1.D\\(ib\\).Fz\\(18px\\)’).text().trim();
console.log(companyName);
return companyName;
}
Thank you so much!!!
Google finance doesn’t have several European ETFs, I really needed yahoo finance integration.
Hey Roger, can you advise what the replacements are on the setup and valid check tabs?
Thanks!
This is a very clever solution Roger. Thank you for sharing.
Does anyone have a working Yahoo Finance Canada version of this spreadsheet?
Hello,
Im getting an ‘access denied’ page when i try to make a copy? Has anyone else ever seen this?
Hi Nick,
Everything looks fine on my end. Tested on a couple different browsers, using regular mode and incognito mode as well.
Can you please try again and let me know if there’s still an issue?
Hi,
First of all let me thank you for all the hard work you put into this spreadsheet.
I’ve been looking into it and will most likely use it from now on.
I am facing a little problem though, I was looking around in the “Your Portfolio Holdings” and in the “In EUR Currency” zone the cost base is still showing the cost in dollars so it’s giving big difference in unrealized gains (cost in dollars comparing with market value in euros), I believe somewhere is missing a conversion to the cost base. I can alter my spreadsheet to fix it but just wanted to let you know in case it’s a problem somewhere that you need to fix.
Or please let me know if I’m missing something.
I have an extra question, I get charged 1% total stock not purchased in EUR (due to currency exchange fee), is there any easy way to deduct this 1% from the gains?
Don’t waste much time investigating this I can most likely tweak the spreadsheet to my needs, it’s just in case you had this question before.
Once again thank you
Hi Djoze,
Please make sure that you have set your main currency as EUR on the Dashboard tab, cell C3. Then on the Your Portfolio Holdings tab, the section in columns Q-Z will be shown in euro currency.
For the trading fees, please input those fees in column H of the Trade Log tab. These values will then be factored in when calculating your gain/loss on trades.
I hope this helps!
I have a similar problem.
I set the currency to EUR, but in the portfolio holdings, the market value of the stock is not beeing converted to EUR, hence the numbers are not correct as the stock was bought in EUR.
Anyways, great job with the whole sheet, saved me tons of time, hopefully we can fix this conversion.
Hi Stef,
On the Your Portfolio Holdings tab, the first set of columns tracks your holdings in the currency in which you bought them (the currencies entered on the Setup tab beside each ticker).
If you scroll right on the Your Portfolio Holdings tab, all values are then be converted into a common currency. Therefore if you have selected EUR at the top of your Dashboard tab, all values will be converted in EUR in that set of columns.
Please let me know if you still have issues with the sheet.
looking good!
I am currently using Portfolio Slicer and i am wondering how hard it would be to implement all the charts in and KPI’s in PS ?
I have been using PS for more than 15 years and i would like to switch but i fear losing all the charts/KPI’s
I can paypal if needed!
Hi Lawrence,
I’ll work on this and hopefully will be able to provide a new version with those improvements.
My day job and life in general have been getting in the way of spending more time on this project!
Hello. I’ve been adding my activity on this spread sheet, but when I press the “GO” button on the monthly performance tab, the Portfolio Starting Value is always 0 for each month. Is there something wrong with the script?
I’ll try to see if my data I inputted was wrong.
Thank you
Hi Henry,
Please refer to the FAQ section of this page, specifically question #8. Please try to delete the data and then re-run the script as mentioned there.
If the error is still appearing, I’d be happy to take a look at your sheet to see if I can identify what’s causing the issue. Please add me as an editor to your sheet (click the share button in the top right corner) and then send me the link to your sheet by email. I can investigate after.
Hi there, first of all thanks for the amazing work you’ve done. I have a problem though: when I want to add my crypto’s to the ‘Setup’ ‘Portfolio Holdings’ it doesn’t work for me. It says it’s a valid symbol but the name isn’t taken over.
Hi Renaud,
Please check google finance to see if the specific cryptocurrency is supported by Google Finance, and what the right ticker to use is. https://www.google.com/finance/
This tool relies on pricing data from Google Finance, so it is limited to what Google supports (BTCUSD, ETHUSD, etc…).
Just wondering if I could also track my GICs in this spreadsheet?
Hi Amy,
Yes this spreadsheet can handle GICs as well. Please see the FAQ section of this page, item #7, which describes tracking cash using the $CASH method.
You can use the same methodology, just using a ticker of $GIC (or something like that) instead. When you get your interest payments, you can add a Dividend transaction on the Trade Log.
Hey:
Thanks for this great job of providing freely a very useful portfolio management tool. Its a boon for small investors who cannot afford hefty subscription fees.
I surely intend to contribute whatever small amount I can afford. Your work needs to be acknowledged– and beyond coffee.
Further, I was curious about following: (i) Is there a way to increase the stock entries in the set up beyond 250 rows? Lets say about 1000 rows. (ii) Can you add Custom Benchmark’s return also just below the total portfolio return on Dashboard for the same corresponding period as selected in the period cells? (iii) How to conveninetly see the individual stock holding account-wise? Because portfolio holing shows the aggregated view. I want to see which stocks and quantities and amount I hold in various accounts. Currently the accountwise info is only for aggregate sum.
Hello, amazing tool for tracking my portfolio.
I’m getting an error (VALUE) after running the script, the error appear just in some cells. Have you ever had something similar before? Any easy fix for it?
Thanks
Hi Lucas,
Please refer to the FAQ section of this page, specifically question #8. Please try to delete the data and then re-run the script as mentioned there.
If the error is still appearing, I’d be happy to take a look at your sheet to see if I can identify what’s causing the issue. Please add me as an editor to your sheet (click the share button in the top right corner) and then send me the link to your sheet by email. I can investigate after.
Sorry for typos: The revised request is as follows: Hello: I have been detecting a consistent error / anomaly in the prices that get picked when I enter a period (from and to) to see the return across period. As the return percentage didnt match with the actual values, I tried to dig and found that the ‘Your Portfolio Holdings’ sheet is not picking the correct prices for the start date. As a result the price change value gets erronous and thus calculated retun percentage is also wrong. Its happening all across for almost all stocks.Pls help / advise.
Hi SS,
I believe we are already connecting via email to solve this. Thanks!
Hello,
I have noticed a small issue which might be caused by GoogleSheets software and not your sheet specifically but still:
When inputing multiple trades on the same instrument, on the same account and the same day, – the Portfolio Holdings tabs will have issues computing the number of shares held. I was unable to get exactly zero shares for fully sold assets in some cases – even by copy/pasting share count.
By adjusting the date of the trade by one day (and nothing else) so they do not collide, porfolio holdings shows correct values.
Not a huge use case but I choose to input my employer match as a separate trade on the same day as my own trade.
The non-zero count in portfolio attracted my attention but there might be other consequences of this issue.
cheers
Hi Pierre,
Thank you reporting this issue. I’ll try to investigate to see what might be causing this. In the meantime, your fix of shifting the trade date by one day sounds like a good solution.
I am getting an error to copy the spreadsheet. Anyone facing the same issue?
Hi Venkata,
It looks like Google Sheets recently changed something on their site. Please try the following:
– Open the spreadsheet: https://docs.google.com/spreadsheets/d/1Id9TXi9SwjqBsoBUUc-nsQRahGaKyRLv2O_ezxLtLgo/edit#gid=755788330
– Click File >> Make a Copy in the file menu
– Click Folder to select your own Google Drive folder (by default it will try to save the file in my personal folder, which Google does not allow)
Hi,
I am trying to make a copy in Google Sheets, but it still says I need Access to do this.
Any ideas what might be wrong?
Hi Guy,
It looks like Google Sheets recently changed something on their site. Please try the following:
– Open the spreadsheet: https://docs.google.com/spreadsheets/d/1Id9TXi9SwjqBsoBUUc-nsQRahGaKyRLv2O_ezxLtLgo/edit#gid=755788330
– Click File >> Make a Copy in the file menu
– Click Folder to select your own Google Drive folder (by default it will try to save the file in my personal folder, which Google does not allow)
Have you noticed that splits break past realized gains? I did a simple test:
1. 01-01-2023 Buy 10 XYZ @ $100
2. 06-01-2023 Sell 10 XYZ @ $110
Realized gains for 2023 is good, showing $10.
3. 01-01-2024 XYZ split 10:1
Realized gains for 2023 now shows as $100.
Sylvester
Hi Sylvester,
In the example you used, the total realized gain is $100 before the split (and also after the split).
I re-created the example myself and the calculations are looking correct to me on the Realized Gain tab — showing $100 gain before and after the split.
Feel free to email me with your sheet, and I can take a look to troubleshoot.
Sorry, I meant to give the example of buying 1 share (or change the numbers I shared with you).
Anyhow, I’ll email you the example where I show the same transactions for 2 shares and then split one of them at 10:1. You’ll see the difference in the realized gains.
Sorry, that was me just sending you the wrong numbers. I’m sharing the spreadsheet with you now.
Thank you Sylvester. To all other users who might happen upon this — Sylvester and I chatted over email and he pointed out an error which occurred in the realized gains calc if a stock split occurs on a date AFTER the initial buy/sell transactions.
I have fixed the spreadsheet and uploaded a new version 8.8.
Thank you Sylvester for the bug catch!
How do you log a symbol change? For example CPG changes it’s symbol to VRN. What is the best way to go about logging this?
Hi Pierre,
In the case of a stock ticker change, or when a company merges with another (also resulting in a ticker change), I’d recommend adding a sell transaction on [Old ticker] and a buy transaction on [New ticker] on the date that the change occurred (using the same share price for both transactions).
I hope this helps.
Absolutely awesome spreadsheet, been looking for something like this for awhile now.
Not sure what I am doing wrong, but I cannot get the monthly performance calculations to work properly.
When I hit go, I get zeros for the portfolio starting and ending values, and the investment returns are -100%.
I’ve tried using a new sheet, but still having the same issue unfortunately.
Hi Adam,
Unfortunately the Monthly Performance tab can be a bit buggy for some users. It works for most people, but can “randomly” break for others.
Can you please share your spreadsheet with me by email? I can take a look to troubleshoot.
Great sheet! Much appreciated.
I am having some problems with the sheet. I realise that Dividend calculations stop somewhere in the first quarter of 2022. I tried poking around with the formulas but I cannot seem to troubleshoot it.
Do you need more information?
Hi RT,
On the Dashboard tab in cell C2, please check that you’ve selected “Today”.
Also, please try refreshing to a new copy of the spreadsheet (make a copy of the latest sheet from this page, copy/paste your Setup and Trade Log data). That should do the trick. Perhaps some formulas were accidentally deleted in your copy.
Yeps. Everything seems to check out, and I have tried copying the data over to a new sheet but dividends stop adding from Q1 2022.
I would be happy to share the sheet with you in case this is an edge case that fell through the cracks.
Hi RT,
Yes please add me as an editor of your spreadsheet and then send me an email with the link please. I can troubleshoot thereafter!
Hi. I have just added you as an editor. Many thanks
Hey. Just wanted to check whether you got the invite link? No rush!
Hi! I believe I responded to you over gmail on Oct 4th.
In case the email got lost, here was my response:
Thanks for reaching out and sharing your sheet.
On your Trade Log tab, I believe your dividends are just recorded in the wrong column. For example, on row 213, if the dividend you received was 28.46, that should be recorded in column G (Total Amount) instead of column F (Amount per Unit).
As it stands, the spreadsheet thinks that the total amount is 0 (0 units x 28.46 per unit = 0).
Arh! The email did get lost.
Thanks a bunch! Stupid error on my part! Appreciate the troubleshooting, Good Sir.
Good to hear! Thanks for confirming that the issue is solved. Cheers
Hi Alan,
Hope you’re well and thank you for your amazing work on this!
I have some issues with the script – I get lots of VALUE fields automatically populated like Lucas further above. Additionally, the Your Portfolio (Indexed) column was getting populate previously when I was using the spreadsheet but it won’t populate after the update. I tried copying the spreadsheet again but I stumble upon the same issues.
Thank you so much in advance!
Best wishes,
Pepo
Hi Pepo,
Unfortunately the Monthly Performance tab can be a bit buggy for some users. It works for most people, but can “randomly” break for others.
Can you please share your spreadsheet with me by email / add me as an editor? I can take a look to troubleshoot.
Hi Alan, Happy New Year and sorry for the incredibly long delay in replying!
I didn’t receive any notification that you have replied and completely forgot about this for a moment.
I can confirm that with the latest version 8.9, the Monthly Performance Tab works flawlessly. Thank you so much for all your work and dedication on this project!
Kind regards,
Pepo
Wonderful — thanks for letting me know Pepo. Cheers and happy new year!
I love this spreadsheet. I have been having an issue though recently.
the sheet has not been recognizing almost half of my holdings. Like on the Setup page, it is not recognizing CSCO and it is giving the error: “When evaluating GOOGLEFINANCE, the query for the symbol: ‘CSCO’ returned no data.” it is having the same issue with almost half my holdings.
Hi Ian,
My personal sheets / tickers are still functioning correctly. CSCO is populating for me. Can you please try to grab a fresh copy of the spreadsheet, and the copy/paste the data from your Setup and Trade Log tabs?
Perhaps something was deleted in your copy of the spreadsheet accidentally.
A couple months back, this spreadsheet suddenly stopped working. Since I recently saw the newest update, I eagerly downloaded it in hopes it would begin working again. However, upon entering my data, I still have the same problem.
It seems things work initially, but then as soon as the screen refreshes, it’s like the program can no longer see the Google data.
I even tried manually reentering my data instead of copying it from the old spreadsheet.
When simply entering my stocks on the setup page, I can enter the first several and the spreadsheet can convert the symbol to the actual stock name, but after entering several more, the screen refreshes and it can no longer see any of the stocks on Google…even the previously entered ones it could see before. Everything just goes blank! Very frustrating!
Hi Jim,
Sorry to hear about this issue. Very strange — first time I hear about this problem.
Can you please share your spreadsheet with me by email / add me as an editor? I can take a look to troubleshoot.
Hey I’ve been using this spreadsheet for a while now and can’t live without it! Awesome work done here and absolutely love it! My question is there anyway to track my cash position in this spreadsheet? Let’s say I have two different cash positions I’d like to track for two different currencies (USD and CAD). Any ideas?
Thank you!
Hi Issa,
This tool wasn’t built to track cash. However, if you do want to keep tabs on your cash balance as well, you can try this workaround:
– On the “Setup” tab, add a new stock ticker called $CASH (or something else that doesn’t return a market value on google finance)
– Whenever you get extra cash in your account — dividends, contribution, etc., enter in a buy transaction on the Trade Log where you purchase X shares of cash at $1 per share (X being the total amount of added cash)
– Then, on the Your Portfolio Holdings tab, in the manual price entry columns (H, AF, AL), input a value of $1 per share for your $CASH investment
– Now, you’ll see your new ticker $CASH, and the corresponding total $ amount reflected
– If you use up that cash, remember that you’ll have to enter a corresponding sell transaction
In your case specifically, you could track USD with $CASHUSD and CAD with $CASHCAD
Thanks for your detailed response. I realized later you have a whole section in your FAQ for those that want to track their cash positions. Appreciate the help!
Hi, thanks for a great sheet. I have invested in both Uber US and Canada. They have the same ticker symbol. How to I track this separately on the Trade log and how does it reflect in dashboard and other sheets?
Thanks
Hi SK,
Please take a read through the FAQ section of this page. There is a topic about finding the right ticker / adding a prefix to record international stocks correctly.
The Dashboard tab will automatically convert all of your stocks into your chosen currency (see top of tab), based on the relevant exchange rate.
Hi there,
Awesome resource, thank you. It doesn’t look like the September 12/2024 edition is working. When I go to that link, it shows the instructions to make a copy to my own drive and when I do, there’s only the same instructions, no spreadsheet.
Hi Jennifer, after you make a copy of the sheet, you should see various “tabs” listed at the bottom of the screen. Do you see a tab for “Setup”, “Trade Log”, and “Dashboard”?
You can navigate to those tabs and start to use the spreadsheet. Please follow the instructions on this page for a walkthrough of how to use it.
Cheers!
Oh my goodness! That was not very bright of me.
Thanks so much for clarifying.
Hi,
Thanks for putting this spreadsheet together and sharing it with the wider community. Great work.
Do you have any suggestion on how to best set the investment category for ETF that uses leverage across multiple categories?
Let me give you an example: NTSX is an ETF that deliver a 90% exposure to large-cap US equities and 60% to US Treasury futures through leverage. Since I can only set 1 investment category per line, I was thinking of simply duplicating the same symbol on 2 lines and set a different investment category per line. But this impact the Quantity of Units and does not resolve the leverage (1 Unit = 0.9 Equity + 0.6 Treasury).
Any suggestions how to integrate?
Thanks.
The monthly performance tab calculation is not correct when a stock has split but you no longer hold any. Example: bought tse:xus in feb for $78, sold it in March for $82 but the calculation assumes I sold for $41 as the ETF split 2:1 in August. I checked the price history in yahoo finance and it does show (now) $41 for March. I guess the stock prices get changed after a split but that makes historical calculations problematic! Hope this can be fixed somehow…
Hi Roland,
The spreadsheet should be handling splits correctly by adjusting both the share price AND the quantity of shares that you held. For example: a $4 gain for 1 share would end up becoming a $2 gain per share for 2 shares (equating to the same $4 total gain). Can you please check the realized gains tab of your spreadsheet? It should display the correct total $ gain for the shares you sold.
If there is still an issue, please feel free to share your spreadsheet with me by email so that I can troubleshoot.
Ok, I found the issue. The ETF split on Aug 8, 2024 but I did not have any at that point so I did NOT track the split and hence when the app looks up the stock price it does not know to account for a split. I have now added the split in and the monthly performance tab is now correct. This does mean I have to continue to “track” stocks I no longer own for historical calculations…
Hello there,
I have been searching for the best google sheets portfolio management, and I’m really hoping I have found it here!
I will have to wait a month or so to find out just how good it is I suppose, as I just set it up today.
One thing that I immediately find myself wishing I could do would be to add another set of Investment Categories.
I was excited to add a whole bunch of categories, but then my pie chart is so splintered its hard to follow. I was thinking it would be great if there was another chart for Sectors. That way I could have the Investment Categories show stuff like: Gold, Equities, BTC, TBills, Bonds, Oil & Gas, etc. Then the SECTOR section could show the division of the Equtiies like: Defensive, Construction & Industrial, Semiconductors, Renewables, Small cap, Cannabis, etc.
Is that an easy add on that I could attempt do you think?
Thanks,
Adam
Is anyone else having an issue running the monthly performance script this morning? I’ve tried it using my current version(8.6) and 8.9 both on Chrome and Firefox. When I click on GO! I get the Drawing menu and the script doesn’t run. Worked fine in September using 8.6 on Firefox. TIA!
Hi Craig,
The monthly performance script is working fine in my personal sheet, and also in my other test sheets. Can you please try running it again? If that doesn’t work, please add me as an editor of the sheet and then send me the link by email. I can take a look to troubleshoot.
Thanks so much.
Quick question – why might the quarterly returns not total up to that of the year.
(1+Q1)*(1+Q2)*(1+Q3)*(1+Q4)-1 should total the Q1-Q4 return
What might be causing the error/issue that results in the above not being true?
Hi Shrey,
The performance metric shown on the Dashboard is calculated based on a “Money-weighted” methodology: https://www.investopedia.com/terms/m/money-weighted-return.asp
This means that the return calculations factors in deposits/withdrawals from the portfolio.
As such, the annual return cannot simply be calculated based on the quarterly returns, it also needs to factor in changes in the portfolio size due to contributions / withdrawals.
Good evening thank you for thsi moumental effort ! couple of commentas/questions if i can for single bonds:
1) How can track perfomance of single gov bond including those reimbursed? (e.g bought a Bund Sept 24, on Oct 22, and reimbursed on sept 24)
2) can I manual input hystorical prices to respresnt , if not continuos (i kow google finance do not help) where should say 2 or 3 manual prices to feed into the rest of the ETF pictures for % return?
bit afraid you will tell me I am hopeless since by the trade log tab one can already notice quantity of units x amount of units is designed only for stock or Etf… apologise if topic was mentioned already.. digged but did not find.
Ezio
Hi Ezio,
You can certainly handle bonds in this spreadsheet. Please search through this page and comments for mentions of “$CASH”. This workaround method can be used for bonds. You can simply call the ticker $BOND or any other name that you’d like.
For the manual price look-ups, please search the comments for references to “VLOOKUP”. You can input manual prices at various dates in a separate tab and then pull them into the Your Portfolio Holdings tab using a VLOOKUP formula.
Hey,
Thanks for making this spreadsheet! I’m currently trying to set it up and enter all my transactions pulled out of Wealthsimple. I’m a canadian like you, and I’m wondering how to enter dividends from US stocks. As an example I have HYLD, which I am entering the USD value when I buy, but when I receive dividends, they are all shown in CAD in Wealthsimple. When I input these dividends into the trade log, am I right in assuming it is expected these to be in USD as well?
Hi Allen,
Yes you’re correct. The dividends need to be entered in the same currency that the price is quoted in. So, if the stock is USD, the dividends need to be entered as USD as well. If Wealthsimple doesn’t offer a way to get the values in local currency, you’d need to manually convert those values to USD before inputting onto the Trade Log.
I hope this helps!
Thank-you for this spreadsheet! It’s just simply fantastic.
One question: is there a way to use the rebalance tab with a single account rather than all accounts? For example, I want my FHSA to have a different asset allocation from my TFSA, RRSP, and NREG, which I want to rebalance as one.
Hi BK,
On the Dashboard tab, change cell C4 to filter on a single account (for example: TFSA). Now, when you go to the re-balancing tab, the numbers will be calculated for the TFSA account only.
You can use this to view re-balancing calcs for a single account.
I hope this helps!
Thank you so much for making this spreadsheet, its awesome so far! One thing I’m having trouble with is the monthly performance. When I run it, the monthly portfolio value table ending value (most recent month) does not match my dashboard portfolio value. Am I missing something here?
Hi Allen,
If you set the Dashboard to view your portfolio value at the end of a month (e.g., Oct. 31st 2024), the total value should match what the value shown on the Monthly Performance tab.
Could you double-check if the values are indeed mis-matched when comparing the same end of month dates? Also please try to refresh the page.
If the error is still appearing, please send that spreadsheet to me by email / add me as an editor. I’d like to troubleshoot if the error is appearing.
Thank you!
I think I may have just accidentally changed a formula somewhere. I couldn’t get it to match up at all no matter what I did so I just copied my transactions into another copy of the spreadsheet and it solved my problem.
One other question about the setup page. I’ve been purchasing CHE.UN Chemtrade Logistics Income Fund. I’m only able to find able to find CGIFF which is the same fund in US dollars. I put my transactions as I see them in Wealthsimple, but its showing a loss because the spreadsheet is pulling CGIFF in USD. Is there some work around for this? or maybe I’m just and idiot and can’t find the right ticker in google finance…
Hi Allen,
Good to hear that it’s working with a fresh sheet.
If you can’t find the correct ticker for a dual-listed stock on google finance, there are two alternatives:
– Approach #1: Use the ticker for the one that you can find (the USD equivalent in your example), and then manually convert your trade log entries into that currency (in your example, track that you would buy the USD stock rather than the CAD one)
– Approach #2: Keep your trade log entries as is (in CAD), but use the manual price lookup columns to input the currency price of that stock in CAD
Hello,
Thanks for this spreadsheet, terrific work! I noticed that the portfolio value at the end of the month is different between the one showed in the Dashboard and the one in the Monthly performance. This happens for a few months, not all of them. What could be the problem? Thanks
Hi Mirco,
If you set the Dashboard to view your portfolio value at the end of a month (e.g., Oct. 31st 2024), the total value should match what the value shown on the Monthly Performance tab.
Could you double-check if the values are indeed mis-matched when comparing the same end of month dates? Also please try to refresh the page.
If the error is still appearing, please send that spreadsheet to me by email / add me as an editor. I’d like to troubleshoot if the error is appearing.
Thank you!
I have shared the file. Thanks for looking into it.
same issue here..perhaps ? on dashboard tab set 30 sep as staring date and 31 oct as end date .. on the monthly perfomance tab the amount correspond with the portfolio holding starting value with col N but differ by portfolio holding with the portfolio ending value col R..
Hi Emilio,
Can you please try with a fresh copy of the spreadsheet? Just copy/paste the info from your Setup and Trade Log tabs.
I made a small fix about a week ago that should hopefully solve this problem.
Please let me know if it doesn’t work for you.
Hi ! think might have found the root cause in my case… got several Vlook up in the manual cells referenced to an “history” tab I created. that work well with any date in the”portfolio holding”..BUT it seems to me that script in the “monthly perfomance ” tab then is not considering any of this data which are valued in the portfolio holding instead this happen also with google hystorical prices when a price on a given date in the past e.g. 28/02/23 is not found…then ir returns a red in the portfolio holding (understandable) so I input a price in the manual column then portfolio holding sum up get fine with the chosen date in c54 28/02/23 at that point but not the “monthly performance” that would not include that amount… hope I was clear… many thanks
Would be nice to have a money-weighted return on each position (perhaps in the holdings tab) that factors in the reinvested dividends.
VWO e.g. has a large dividend and it’d be nice to see how it’s performing overall vs funds that have a lower dividend.
IIUC we could model this by not including the dividend in the trade log and just logging a buy with 0 cost basis?
Thank you Steve for your comment. You can do this type on analysis on the “Your Portfolio Holdings” tab by summing up unrealized gains plus dividends received, divided by the cost base for the position. This will show the total return (price gain + dividend gain) earned for each stock in your portfolio.
I’ll keep this in mind for a future version of the tool.
Hello,
Thnaks for this spreadsheet! I was trying to input some ETF (DE0002635307) but google finance doesn’t recognize them. Is there a solution that would work without impacting the whole sheet?
Hi Andrea,
Please read through the Frequently Asked Questions (FAQ) section of this page, particularly item #2 which discusses the manual price entry columns.
Hi!
Thank you so much for this!
I searched a lot for a good one, and it’s for sure the best one!
I tried looking through the comments, but couldn’t an answer to that:
I’m in the EU, so most of my ETFs are from EU exchanges like London Stock Exchange Domestic, Ireland, or Germany
When I try to put my ETF (Russel 2000 for example, ISIN IE00BJZ2DD79, TICKER XRSU) it does not recognize it.
The “search” function does not seem to work for me?
What should I do? Maybe I’m not putting the right ticker?
Hi Yarden,
If you search that fund (XRSU), the fund name is Xtrackers Russell 2000. If you plug that into the Google Finance search bar, you’ll find that the ticker is LON:XRSU.
https://www.google.com/finance/quote/XRSU:LON?sa=X&ved=2ahUKEwiWgJaFxe2JAxWrr1YBHYj1LkEQ3ecFegQIPxAf
That ticker seems to work in the portfolio tracker.
I am having a problem with some of the mutual fund stock symbol for example DFEVX, DFFVX, DFIVX, DFVQX. ‘Your portfolio holdings’ sheet is not pulling the quantity or cost base entered in trade log sheet and is populating as zero.
Tried refresh, exit and reload, etc. Can this be resolved? Thanks so much for your effort.
Hi Varora,
Please read through the Frequently Asked Questions section of this page, particularly item #2 which discusses the right ticker symbol to use, and the manual price entry columns.
If your funds are not available on Google Finance, you’d need to use the manual price entry columns instead.
I hope this helps!
Thank you for your prompt response. I had the right ticker and exchange populated but the issue was with the future date populated against the above tickers. Thanks again!
Good to hear! Thanks for confirming and happy tracking.
The new sheet is said to have support for spin offs, how would you input that in the Trade Log?
Hi DM,
Please see the “Corporate Actions” tab near the end of the spreadsheet. There are instructions listed on that tab.
Once you’ve filled in the details, the tool will generate transactions that you can paste onto your Trade Log tab.
Let me know if you have any difficulties with the process. Cheers!
My Monthly dividends are not showing up on Dividends tab,but they show up on Monthly performace
Hi Atif,
Have you inputted those dividend transactions on your Trade Log? Please double check the dates and tickers to ensure that they’ve been inputted correctly. You can refer to the FAQ section of this page for an example of how to input dividends.
is it possible to get a Daily % Gain on the Portfolio Holdings tab? Much like you’d see if you visited the ticker on google stocks or yahoo.
Hi DM,
Please see this reddit thread for a formula that can be used to get the daily return of a stock: https://www.reddit.com/r/googlesheets/comments/1bk0o4f/google_finance_formula_for_specific_date/
You’d just need to adjust that formula to reference the correct ticker and today’s / yesterday’s dates.
I’d prefer not to add this into the master version of the spreadsheet as I’ve noticed that the sheet is starting to become quite slow especially if tracking many stocks. Adding more calls to google finance will slow down the sheet further.
I hope this helps!
Thank you so much for sharing your beautiful work with us. I am having difficulty getting the “Monthly Performance” tab to populate. I followed directions by pressing the “GO” button to run the script (and allowed google to run it.) The error message I am getting is “Exception: Range Not Found”. (there is “#NUM” in cell G30 which says: “Function YEAR parameter 1 value is negative. It should be positive or zero”.) When I hard code in a number to that cell, the next error message I get is “Exception: Enter a valid date”.
I figured out my issue above (in comment #522) so please disregard the above question.
I do have another question:
On the dashboard tab, the option right now is to select either a single investment account in the drop down menu OR ALL of the accounts. Is it possible to select a few but not all somehow? What would I need to do to the spreadsheet to engineer this? Thank you.
Hi Deborah,
Unfortunately, selecting multiple accounts (but not all accounts) is not currently possible in the sheet. I’ll keep that in mind for future versions, but it would require significant work to change functions on many tabs.
Hi, the portfolio tracker has been great to track a portfolio in a different currency as the original.
I seem to be having some issues with the Dashboard page, where my total portfolio market value does not match the Portfolio Ending value in cell G76. The discrepancy is quite large.
I have confirmed that the end date in cell C54 is correct. What could be going wrong, or is this expected?
My cash and cash equivalent “return” is at a -25% or so, which does not make sense. I do not know if my trade log is inaccurate but my final portfolio holdings seem correct.
Please ignore my previous question that has yet not been published. For the cash portion, I had just updated my spreadsheet from v8.5 to 8.9, and had not manually added a market value of 1 in the portfolio holdings section in the investment performance section.
Hi Ram,
Thanks for confirming. Glad to hear the sheet is working for you.
no questions yet-just returning here after 2-3 years and still notice this is one of the best google sheets tools out there–thanks again man–
Thank you Kiran, I really appreciate that feedback. Happy holidays to you and your family.
What an amazing spreadsheet! Thank you for your hard work. Took me awhile to input only my last 2 years across my portfolio – but everything ran perfectly.
I just need to start making sense of the results.
Only oddity I noticed that in My Dashboard only RRSP and LIRA holdings are displayed in the pie chart. It’s missing LIRA and CASH holdings even though I’ve defined those and properly selected them in my Trade Log. Any idea why?
Thanks Ian, glad the sheet is working well for you.
For the holdings that aren’t showing up on the Dashboard, are those tickers that don’t have automatic price lookup from Google Finance (there is a Yes/No flag on the Setup tab beside where you enter the tickers).
If so, you’ll need to use the manual price input columns on the Your Portfolio Holdings tab (columns H, AF, AL) — see the FAQ section of this page for more details.
Once you input those manual prices for holdings which don’t appear on Google Finance, the total value will now be reflected on your Dashboard.
I hope this helps!
Hi there! Just wanted to say, this is a great spreadsheet all in all!
Just one quick question for USD investments and reporting in CAD for CRA tax purposes, does the spreadsheet take into account both the USD/CAD rate at time of buying and selling?
Thank you!
Hi Maddjik,
Happy to hear it. Yes, the spreadsheet uses the relevant exchange rate at the time of buying and selling the stock — so the calculations of realized gains are accurate for CRA filing purposes.
Thanks for creating and sharing this spreadsheet. Your generosity is truly appreciated. I’m still learning the various features of the spreadsheet, but there’s one problem I can’t solve. When I click on the “GO” button on the Monthly Performance tab, it gives me this error “Exceeded maximum execution time”.
Is there any way to fix this?
Thanks again!
Hi Roadie,
When you click the GO button, the script should run and start to fill up columns N to T with data about your monthly performance (it goes sequentially from the oldest month towards the newest month).
Do you see that the data is starting to populate in columns N to T?
If so, you’ll just need to click the GO button again, which will populate more data. If the maximum execution time is exceeded again, just click the button again.
Unfortunately Google Sheets enforces a script cancellation after ~5 minutes of run-time. I haven’t found a way to get around this.
I hope this helps!
Had this recommended by a couple of people so decided to check it out but I have a couple of questions. I imagine the dividend question may have already been asked but here goes anyway. I’ve entered about a years worth of transactions and I was told to put Dividends as a Dividend and then a buy. Then when I was looking at my account holdings I noticed my # of shares wasn’t right. So I went back and entered the ‘Dividends Reinvested as Buys’ so I could enter the fractional # of shares purchased but I now wonder if that is wrong based on how you calculate dividends.
2nd question is I have a few accounts and for some reason my RRSP account is off my a few thousand even though if I compare the funds and the # of shares I have and the Market value they seem to be pretty close yet when I look at Dashboard and filter just on RRSP I am short about $17k yet the # of individual holdings is right. 3 holdings are in USD so could that be the reason?
Hi GKing,
For dividends which are reinvested to buy more shares — please input two separate transactions on the Trade Log — a DIVIDEND transaction for the total $ received, and then a BUY transaction for the new shares purchased. You can enter fractional shares purchased on the Trade Log.
For the difference in your RRSP balance, the spreadsheet should be converting all values into a single common currency, you can set the currency at the top of the Dashboard tab (you can view your portfolio all in CAD, or all in USD). For your USD stocks, can you confirm that on the Setup tab you have entered USD beside those tickers?
I can’t seem to get the ‘GO’ button to work on the Monthly Performance sheet. When I click it, it selects a blue box around it. When I double click it opens up a graphic page with the box on it. Any help?
Hi Wvan,
Can you confirm that you’re using the spreadsheet in Google Sheets software? Unfortunately this doesn’t work in excel.
If you do a single left-click anywhere within the pink “GO” box, it should start to run the script. Please wait up to 30 seconds for the script to start. The script will ask you to authorize with a few steps the first time you click it.
Could you let me know if you are still having issues with it?
Hi,
I scoured the net for an excel sheet to organize and structure my investments and found this. Unfortunately it has just too few currencies for a well diversified non-euro-zone Northern European investor and Google Finance does not cover all the stocks and funds around here.
But with some tweaks to the headings it now serves as a great way to visualize and follow up and evaluate my different investment strategies (‘accounts’) and sectoral and currency balance in each (‘category’ and currency).
Fantastic to be able to get such a detailed follow up with relatively little effort.
Thank you!
Hi Martin,
Thanks for your feedback and I’m happy to hear it was easy to make customizations to improve the tool for your situation.
Cheers and happy portfolio tracking
Hi,
A feature which I could not find in the sheet but for which the underlying information is already there would be total trading costs per year per account, also expressed as a proportion of that account.
It would be interesting to see what the cost of my trades are in proportion to my portfolio, ie if I manage to beat the expense ratio of ETFs/mutual funds.
‘Nice’ rather than ‘need’ to have – in terms of total performance this is of course already built into the comparisons with the indexes on the monthly perfomance tab – but it would be interesting to see how my total transaction costs compare to fund charges.
But the sheet is great as is. Thank you again!
Thank you Martin. I’ll keep that suggestion in mind for future versions of the spreadsheet.
This spreadsheet has been really helpful. Glad humans like you exist. All power and good health to you.
How do I select multiple accounts in the account filter on the Dashboard tab? also, would you suggest I keep TFSA split as 2 investment accounts if I use both Questrade and Wealthsimple (have some positions from when I started) or just use a blanket “TFSA account”. I wish to have that view into how both are doing individually as well combined.
Thanks for all your input.
Additionally I also see for some reason “META” is not getting selected when I try to set it up as a stock. I did select META, USD, Tech (stock, currency and investment category). I added FB and it showed Meta platforms on the portfolio holdings in Setup, but in “Your portfolio holdings” tab its taking the wrong values.
Hey there, just one more question. Sorry for adding back to back questions. I added “META, USD, Tech” in the setup under portfolio holdings table, but it doesnt recognize that, but recognizes “FB” as Met platforms inc, but it doesnt get the right price from Google on the “your portfolio holdings” tab, shows me error on dashboard andwhen I add the price manually on column H, AF and AL on the “YPH” tab – it still doesnt work.
The issue with google finance. More details can be found here: https://www.reddit.com/r/googlesheets/comments/1i7za6d/meta_ticker_symbol_not_working_in_sheet_suddenly/
Thank you for helping out. It seems that Google Finance has fixed the issue now — price for META is showing for me now.
Hi Karthik,
Please use the ticker META, that is the correct one.
As the other commenter pointed out, this was an issue on the Google Finance side.
It seems they have fixed the issue now and the price is showing correctly for me again.
You can remove the manual price entries now that the price is flowing correctly again from Google.
Hi ! thanks a lot for your efforts mate.
here is my Question:
1)the monthly perfomance “GO script” will still work with Hystorical data when those get input in the manual input column and not deriving automatically by Google Finance?
2) what if I am using “Vlook up” formula and referencing to an additional tab containg “day by day” hystorical data for each missing ticker (as a consequence of not being avalaible in Google finance)? At that point will the script pick up and elaborate also any intermediate date /data present in my hystorical tab or only that particular “end date” as defined in dashboard? if not picking up or elaborating each single day of my tab how the “GO script” is impacted? just assumption but I found some inconsistencies in the monthly performance calculation and was wondering that could be a possible root cause
Many thanks
Franco
Hi Franco,
The Monthly Performance tab will work correctly even for manual price entries, as long as:
– you’ve created your own historical pricing database for any stocks that Google Finance can’t find
– you use vlookup formulas to populate columns H, AF, and AL of the “Your Portfolio Holdings” tab
It will still work even if you don’t have day-by-day data. In your VLOOKUP formulas, set the final value to TRUE, which will give an approximate match.
This means that the formula will find the previous date if the exact date you’re looking for cannot be found.
https://www.statology.org/excel-vlookup-true-false/
many thanks for your help !!
just o give you an idea
=IF(AJ63>0;IF(Dashboard!$C$54=TODAY();IMPORTXML(“https://www.teleborsa.it/obbligazioni/bonos-tf-0percent-mg25-eur-es0000012k38-es0000012k38-RVMwMDAwMDEySzM4″;”//*[@id=’ctl00_phContents_ctlHeader_lblPrice’]”); VLOOKUP(Dashboard!$C$54; SPAMAG25; 2; FALSE)); “”)
col. AL for manual input is using above formula and essentially says…. if date is today() use formula importxml and get real time data from teleborsa site… and it works !! if not ….so for any hystorical price data use a vlookup and search that price within the hystorical range of cell named SPAMAG25 located in a different tab i named “hystory” containing about 35 columns of different isins… aand it works….. but was not sure if script would pick up prices not currently “on show” in the portfolio holding tab for AL or AF or H …..
As you pointed out I put FALSE and not TRUE at the end of the formula ….. need to understand now the sense of your modification then check cautiously before messing up now with the change, will make a copy of the entire sheet before
hope I was clear what i am tryng to accomplish.. you can be sure I m longing to get rid of my bond ladder just for this reason….
Anyone able to make TSE:CASH work with Google finance? It worked until earlier this week when suddenly it no longer recognized it
I noticed this as well as I hold TSE:CASH in my portfolio. It seems that the ticker has broken on Google Finance recently. Sometimes it takes a few days or weeks for them to fix it.
For now, please put a manual value of $50 in columns H, AF, and AL for that ticker. TSE:CASH trades in a very narrow range near ~$50, so this will be quite accurate for now.
Hopefully Google can fix that ticker soon.
FYI QQC is also broken.
How should I properly report RSUs (Restricted Stock Units) on my tax returns after they vest? Since these stocks were granted as compensation rather than purchased, what’s the correct way to document and report this type of transaction?
I would also like to know this. RSUs are awarded so their Amount per unit is technically 0. You did not buy them. How can this be captured accurately?
Hi Em,
I would treat RSUs as if they were cash compensation given by your employer, which you then used to purchase shares. As such, I’d simply use a normal BUY transaction for the shares.
Hey! Thank you very much for what you do. It is amazing how much support you are still doing after so many year.
I am using “IPT” since 2022. Only today I realize I was using the version 8.5 while we are now at 8.9
Since I personalized a lot my 8.5 file, is there the possibility to have a chancelog? Just to check if what you added during this years should make me redo my persona “IPT”.
Thanks love you!
Hi Vincenzo,
Please check the tabs near the end of the spreadsheet! There is a “Changelog” tab which has notes on what improvements were made in recent versions.
Cheers and happy portfolio tracking!
Hi! Thank you for your spreadsheet.
After more than 2 years, I have a lot of entries. Is it possible, when I reopen the spreadsheet, to begin at the date that we closed the last time?
Thanks and have a great day!
Hi Alain,
As far as I know there’s no way to do this in Google Sheets. However, you can easily move to the final row of a spreadsheet by pressing CONTROL + DOWN ARROW (on a Mac: COMMAND + DOWN ARROW). If you do this in the Trade Log tab table of information, this will automatically take you to the final row of the spreadsheet.
Thank you very much for the spreadsheet. It has made portfolio tracking much simpler.
One feature that would be much appreciated is the money-weighted return per stock/ETF.
Are there any plans for including this in the future?
Hi Harvey,
I have tested this before but unfortunately it made the spreadsheet run quite slowly (given that there are 250 max tickers and the calculation of money-weighted return is quite complex). If I figure out a more performant way to do this I’ll certainly add it to the master spreadsheet.
Thank you for the update. It would be a quite useful feature in my opinion since I base many of my sell decisions on current rate of return.
Hello, Thank you for this worksheet.
Its getting me all excited. Its not long since i started my investing journey in Canada. i would have last 3 years of few tardes that i kept building under TFSA and recently FHSA through welathsimple. My overall portfolio would be <70k, but i am excited about the insights that such worksheeet could give me. I am always thinking about how more to diversify but i could not find my asset allocation until now, which can help me judge my maximum to minimum allocation. So thank you again for helping me setup this process.
I had a basic question, my overall portfolio is built around ETFS and CDRS and probably i would invest in few select US stocks in future. When i am starting to build the worksheet, it asks me to select investment category for every ticker, and i am not feeling very confident on which category to pick. i dont want to randomly go picking categories and then not get the insights which are desired.
Hence trying to get educated from gurus.
For eg- VFV- should it be international equity as it has 100 market allocation in US market or would it be multi asset considering its has mix of different equtiies. Similarly for XEQT, market allocation is shared between US and Canada, which category do i pick?
If there is a link explaining this, feel free to paste it.
Just curious do we have a telegram link or some reddit/facebook channel where users of this worksheet are enageged ?
Also, while inputting fields in Trade Log what should i input for trading fees? I am only buying ETFs at the momentand i believe it is not same as MER (Management expense ratio).
Should that be left blank or am i missing some understanding
Hi Prerit,
You can use the trading fee column to capture any fees incurred for buying and selling shares. For example, some brokerages charge $5-10 each time you buy or sell shares.
Understood, So MER are nto supposed to be captured here. and ETF dont have trading fees usually. So need to leave it blank.
Can you respond to my investment category question 542.
Fantastic sheet, must sort you out a coffee!
On the setup sheet I do not think the pence/cents chart is not working correctly.
I have shares in Rolls Royce (LON:RR) which trades on GPX/pence. I have therefore put a Y next to the respective cell in column H. I have input the share price in pence on the trade log as well as the unit price in pence.
Thanks again for all your sheets, incredibly helpful.
When I then look at the dashboard and other analytics tabs, it shows I have 99% of my overall investments in Rolls Royce which is not true.
Hoping I’m just missing something and it’s an easy fix.
Hi Reece,
You’ll just need to input your trades in pounds for Rolls Royce and similar stocks. For example, if you bought 10 shares at 641 pence, enter 6.41 as your buy price on the trade log (the price in Pounds). The spreadsheet will handle the conversion for you afterwards.
I hope this helps, and any coffees would be much appreciated!
Excellent, thanks for getting back to me. That all seemed to work.
What is the reason for the pence table and inputting the Y? Is it for background calculations?
Hi,
I love this spreadsheet tracker and have been using it for years to keep on top of things. I recently started using the rebalancing tab, which is really useful, but seems to have a bug where it doesn’t respect the setting for the stock-price being quoted in cents (pence) – e.g. for LON:XLKQ the price/value elsewhere in the sheet is correct but on the rebalancing tab it is x100.
I did try to take a look and see if I could fix this, but I can’t even find the column that is referred to on that tab (col Y), it must be hidden in some way that I can’t work out!
Have found the hidden columns and fixed it with a vlookup to the setup tab and divide by 100 if it says quoted in cents… not sure if that’s the best way but seems to work!
In “S&P 500 Data” I’m currently receiving a #REF! error with “Import Range internal error.”
The source sheet with all the data seems fine, but it is unable to import it, any suggestion? thank you.
Hello,
I’m struggling to understand what Reinvest Capital Gains is doing.
Let’s say my initial BUY is 100 shares at $100; my cost basis is $10,000. I have a Capital Gain distribution of $1,000.
Whether I enter a Reinvest Capital Gains with just the amount of $1,000, for 10 shares at $100 and let it calculate the $1000, it looks like my Cost basis increases to $11,000, but the number of shares does not increase; it stays at 100.
But if I then enter a BUY transaction for 10 shares at $100, my number of shares now shows 110, buy my cost basis reflects another $1000 increase, to $12,000.
I can’t figure out how to enter a reinvested capital gain that does not double the increase to my cost basis. I’m probably missing something basic, but I don’t know what.
Thanks
Hello.
Thanks for sharing this amazing tool!
Before inputing all my historical data, I would like to understand how to treat assets that are not trackable through Google Finance.
I have plenty of fixed income investments and hedge funds for which Google Finance does not track the price.
I understand that I need to “invent” a ticker on the Setup tab, and register a Buy transaction for each asset on the Trade Log tab, and manually input Market Value on column H of Portfolio Holdings tab.
But my question is how will the spreadsheet track the monthly performance from now on? Should I monthly input the market value of the asset? How can the spreadsheet keep track of the evolution of the asset value through the months if I am inputing only the current market value and deleting last month value on the H column?
This spreadsheet is great! Thank you so much for all your hard work. I have a complex portfolio with 5000+ trades. I had to extend the formulas in “Calc Trade Log” in order to get all the correct calculations, but the performance calculations are still incorrect when I filter for all my accounts (it shows a WAY higher percentage than my overall performance). I think I tracked the problem to the “Calculations” tab, where it registers the correct number of cash flows (>5000), but only shows 1800 lines below, which might be throwing off the IRR calculation? Any idea how I might correct this problem? I’d love to be able to see the overall performance of all of my accounts.
Hi there, first and foremost thanks for this file it’s awesome! I am wondering if there’s something to calculate the capital gain? Like I have same stocks in “Taxable”and “non taxable” account and I sold some in taxable and I can get my acb by selecting ACB but i don’t really see hot to get the capital gain based on the selling fx and all? Am i missing something
Hi, Thanks for this amazing sheet.
I’m having an issue. I read through the above conversations and found that you are using 8 decimals for calculations.
How can I increase this? Because of this, most of the fractional shares investment calculations are incorrect.
Thank you once again.
Hi there, again, thanks for this spreadsheet, it’s a thing of beauty. Question:
What’s the use of the “Cost Base Adj.” transaction type in the Trade Log tab, and how to use it?
Nice tool, thanks for sharing. Question: how would you keep track of dividends if they are paid in a different currency that their associated shares? e.g. shares in local currency that pay dividends in USD.