“Tinker, tailor,
soldier, sailor,
rich man, poor man,
beggar man, thief,
doctor, baker,
fine shoe-maker…”
Apart from being lyrics to a Yardbirds song from the late 60s, what does our cast of characters have in common?
Well, if you asked them, they’d tell you that they were all part of the middle class!
In a society where nearly everyone seems to think of themselves as being middle class, what does it mean for someone to have a ‘high income’?
Using data from Statistics Canada, this article will try to get to the bottom of that question, with particular focus placed on:
I want to highlight these facts and figures for two reasons.
1) From a citizen’s perspective — I hope that this data can help to drive a healthier and more fact-based discussion on important societal debates like income inequality and “fair” taxation levels for the rich.
2) From a financial perspective — I’d like to provide some broader context to the financial recommendations that you receive. What works for someone whose income is in the top 5% might not be suitable for someone in the bottom 50%. By understanding where you stack up in the distribution, you can seek out more tailored advice.
Before we begin, a quick disclaimer: I am by no means an expert in the fields of economics, history, or politics.
Thus, I’ve tried to let the data speak for itself, and have also tried to refrain from making ‘value judgments’ about whether something is right or wrong.
And without further ado, the data…
Throughout this analysis, we’ll be dividing the Canadian population base into the groups shown below:
In total, the dataset encompasses the roughly 28 million Canadians who submitted an income tax return for the 2017 tax year.
A couple of notes: throughout this analysis, the dollar amounts shown represent individual incomes (total pre-tax amount reported on an individual’s tax return), as opposed to household income figures.
Also, at the time of my writing this (March 2020), the most recently published Statistics Canada data is from the 2017 tax year. So… that is what we are making do with!
The chart below shows the annual income thresholds required to join each of the groups (i.e., the minimum amount earned by those in the group).
Putting it into words, the top 0.01% of Canadians earned an income of at least $2.7 million in 2017, while the top 1% group earned an income of at least $236,000.
Meanwhile, to be a part of the top half of Canadians, you needed to earn a relatively humble income of $35,100 or more.
While the chart above shows the minimum incomes required to join each of the groups, the next chart shows the median incomes within each of those groups (i.e., the income earned by a person in the middle of the group).
The top 1% of Canadians earned a median income of $323,500 in 2017, compared against a median income of $35,100 across the country as a whole.
The bottom 50% of Canadians earned a median annual income of only $17,800.
While nearly 70% of Canadians consider themselves to be “middle class”, we have to draw lines in the sand somewhere!
Everyone can have (and is entitled to) their own opinion on the matter, but I’ll offer my two cents based on the data above:
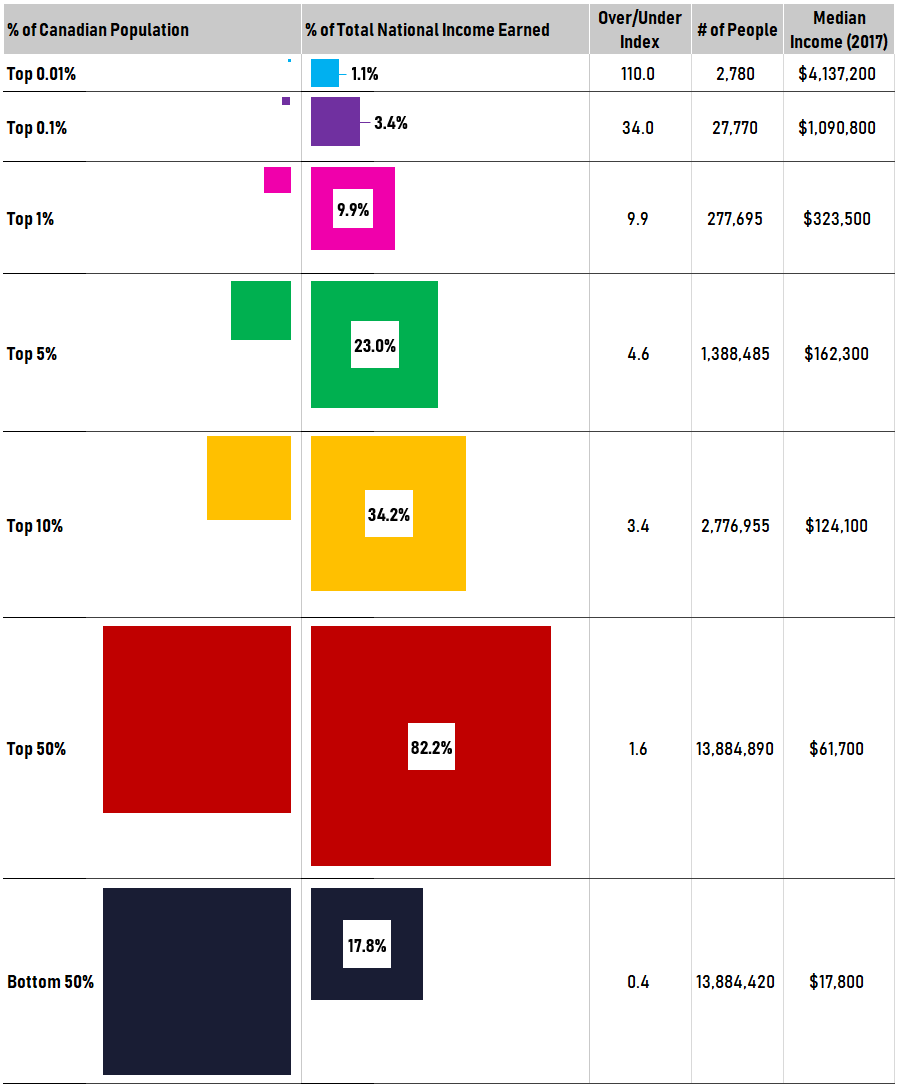
Our next chart gives a sense for the state of income inequality in Canada.
The areas of the boxes in the first column show the relative size of each group in terms of population.
Meanwhile, the areas of the boxes in the second column show the share of overall national income controlled by that group.
(Click to expand the image in a new tab)
Let’s use the first row as an example. The top 0.01% group covers the 2,780 people in Canada who earned the highest incomes in the country.
Given the small size of the group (one hundredth of one percent of Canada’s total population), the bright blue box in the first column barely registers as a blip on the screen.
However, this group of Canadians earned an enormous amount of income in 2017 — with median income of $4.1 million per person! This group earned 1.1% of Canada’s total income in 2017.
This works out to an “over-indexing” factor of about 110 (since the group makes up only 0.01% of Canada’s population but earned 1.1% of Canada’s income).
In contrast, the bottom 50% of Canadians only earned 17.8% of Canada’s national income and is thus “under-indexed” on the income-to-population ratio.
Long story short — the Canadians at the top of the income pyramid earn significantly more than those in the middle or bottom of the stack. I’m sure that this comes as a surprise to just about no one.
But has it always been this way? The next chart shows the ratio of income earned by Canada’s top 1% versus the income earned by the average Canadian, from 1982 to 2017.
In 2017, the median top 1% Canadian earned an income of $323,500, compared to $35,100 across all Canadians — implying that people in the top 1% earned 9.2 times more income than the average Canadian.
By this metric, we can see that in general, income inequality has increased from the 1980’s to today.
For sake of comparison, in 1982, Canada’s top 1% earned 6.7 times more income versus the average Canadian ($214,483 versus $31,828, in inflation-adjusted 2017 dollars).
However, it’s also worth noting that ‘top 1% vs Canadian average’ income ratio has actually decreased from 2007, when it stood at a high of 10.6.
The next few charts show how the share of income earned by each group compares against the income taxes paid by that group, and the tax rates paid by each group.
Canada uses a “progressive tax system”, meaning that as you make more money, the income tax rate that you pay also increases.
Putting this in more concrete terms, and using figures from the chart above:
Over the last few decades, this general pattern has held firm. As you can see below, the share of taxes paid by the top 1% has been roughly double their share of income earned.
To visualize Canada’s progressive income tax system at work, the next chart shows the effective income tax rates paid by each of the groups.
Canada’s highest income earners — those in the top 10% — are paying effective tax rates of 25% to 40%.
In contrast, the bottom 50% pays an income tax rate of roughly 5%.
Across all Canadians, the average tax rate has hovered around the 15% to 20% range.
The StatsCan dataset also provides a fascinating glimpse into how the male vs female split of Canada’s highest income earners has changed over time.
Across all income groups, the numbers are trending closer to a 50-50 split as time passes.
For example: in 1982, only 10% of Canada’s top 1% were women.
Fast forward to 2017, and women now make up nearly 25% of Canada’s one-percenters.
In a country as large and diverse as Canada, relying on broad ‘national average’ metrics doesn’t do justice to the differences between individual regions (Toronto vs Saskatoon, Quebec vs BC, etc).
To that end, the following charts dig into the nitty-gritty regional details, giving us a sense for what it means to be in the top 1% in major cities around the country, and across all provinces / territories.
To break into the top 1% of all Canadians, you’d need an income of at least $236,000.
However, joining the 1% club in Calgary would require an income of at least $374,300.
On the other end of the spectrum, a top 1%er in Trois-Rivières would “only” need to earn an income of $174,100.
Taking a province or territory view largely shows the same story.
Incomes are relatively higher in AB / ON / BC, and relatively lower in the rest of the country (Atlantic Canada / QC / MB / SK / the Territories).
The next two charts show the median incomes earned by the top 1% (the income earned by a person in the middle of the group).
First up is the data shown by major city, and second by province / territory.
The final set of charts shows the share of income earned by the top 1%.
These charts give us a sense for the inequality of income in different regions across the country.
The top 1% controls the highest share of income in the urban hubs of Toronto, Calgary, Vancouver, and Montréal.
And that’s all for now! After getting through that barrage of data, I’d be curious to hear your thoughts:
If you’d like to share your thoughts, you can do so in the comments below, or through email at themeasureofaplan@gmail.com
—
If you’d like to continue exploring through this dataset, feel free to check out:
My spreadsheet, containing all of the source data and charts displayed in this article (download here).
Statistics Canada Sources:
—
Header image credit: Maria Hergueta
View Comments
Great article to read indeed. I have a quick question about this calculation. I have an incorporated business which generates about $1.2M net income annually however, I and my spouse only withdraw about $300,000 as dividend/salary because that’s pretty much all we need to sustain our living. Rest I leave it in business account due to tax saving purpose. In this case, will my household income be calculated as $300,000? If so, this top 0.01% or 0.1% are not quite accurate as it seems because I know many high profile individuals who do the same as I do. I would like to know if those incorporation income taxes are factored in. Thanks for your input.
Hey Tyler;
My understanding is that the data reflects personal/individual income. Funds that remain in your business are not realized income to you as an individual. Essentially this is equity, just like the value of a persons home is not income. Your business dollars would be a measure of wealth, but not income.
If by demonizing the 0.1% you think that by increasing their taxes will make things better for the middle class you don’t know what it takes to be in that category. To get into this category many transactions between many people must occur, this takes a lot of labour as no person can do this alone. In this category you will find primarily business people often with higher education, but not exclusively this category. More risk and reward is often taken, therefore pre selecting men in this type of occupation. What might make things better would be to lower taxes on this group and use policy to stop the globalization of many Canadian industries. The more that you tax the 0.1% the more that they jump ship. These are the facts of this data set.
Interesting article. It would also be interesting to look at just earned income and restrict the population to those with income related to employment and self employment. I expect the median earned income would be different than the median total income because retirees are not included.