March 4th, 2020 | Posted in Data & Insights

“Tinker, tailor,
soldier, sailor,
rich man, poor man,
beggar man, thief,
doctor, baker,
fine shoe-maker…”
Apart from being lyrics to a Yardbirds song from the late 60s, what does our cast of characters have in common?
Well, if you asked them, they’d tell you that they were all part of the middle class!
In a society where nearly everyone seems to think of themselves as being middle class, what does it mean for someone to have a ‘high income’?
Using data from Statistics Canada, this article will try to get to the bottom of that question, with particular focus placed on:
- How much you need to earn to be join the club of ‘high-income Canadians’ (specifically: the top 0.01%, top 0.1%, top 1%, top 5%, top 10%, and top 50% groups)
- Comparing the share of income earned by those at the top versus their share of income taxes paid
- Trend analysis going back to the 1980’s, including a look at how the male vs female split of high-income Canadians has changed over time
- What it takes to be a 1%er in different cities, provinces, and territories across the country
I want to highlight these facts and figures for two reasons.
1) From a citizen’s perspective — I hope that this data can help to drive a healthier and more fact-based discussion on important societal debates like income inequality and “fair” taxation levels for the rich.
2) From a financial perspective — I’d like to provide some broader context to the financial recommendations that you receive. What works for someone whose income is in the top 5% might not be suitable for someone in the bottom 50%. By understanding where you stack up in the distribution, you can seek out more tailored advice.
Before we begin, a quick disclaimer: I am by no means an expert in the fields of economics, history, or politics.
Thus, I’ve tried to let the data speak for itself, and have also tried to refrain from making ‘value judgments’ about whether something is right or wrong.
And without further ado, the data…
Richest, Richer, Rich… and Everybody Else
Throughout this analysis, we’ll be dividing the Canadian population base into the groups shown below:
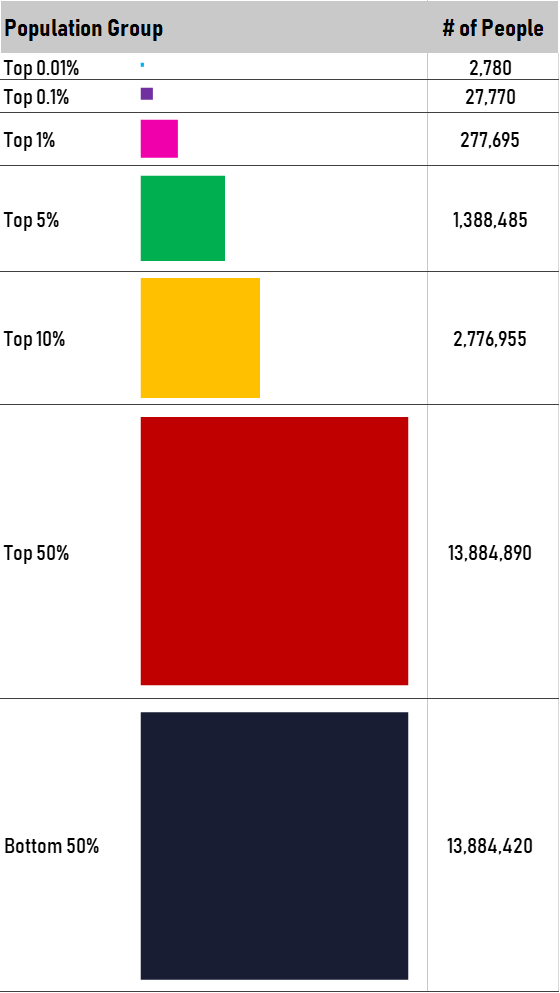
In total, the dataset encompasses the roughly 28 million Canadians who submitted an income tax return for the 2017 tax year.
A couple of notes: throughout this analysis, the dollar amounts shown represent individual incomes (total pre-tax amount reported on an individual’s tax return), as opposed to household income figures.
Also, at the time of my writing this (March 2020), the most recently published Statistics Canada data is from the 2017 tax year. So… that is what we are making do with!
How Much Do High-Income Canadians Earn?
The chart below shows the annual income thresholds required to join each of the groups (i.e., the minimum amount earned by those in the group).
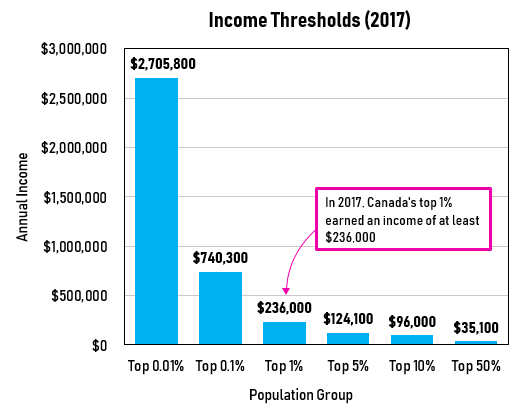
Putting it into words, the top 0.01% of Canadians earned an income of at least $2.7 million in 2017, while the top 1% group earned an income of at least $236,000.
Meanwhile, to be a part of the top half of Canadians, you needed to earn a relatively humble income of $35,100 or more.
While the chart above shows the minimum incomes required to join each of the groups, the next chart shows the median incomes within each of those groups (i.e., the income earned by a person in the middle of the group).
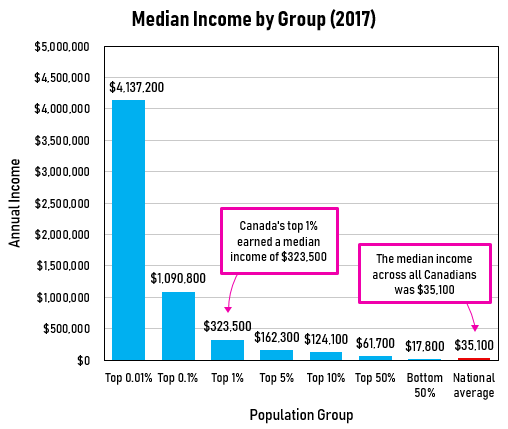
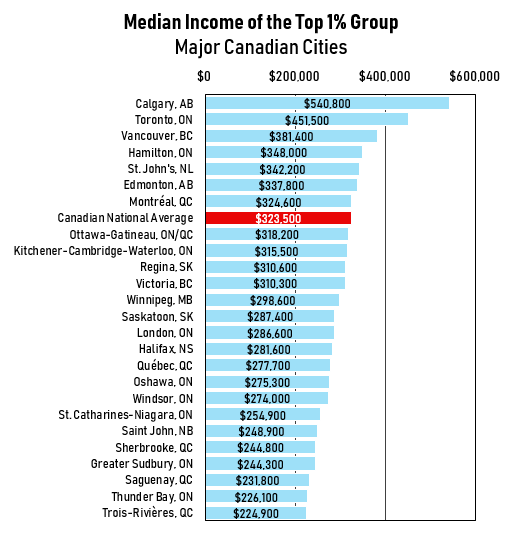
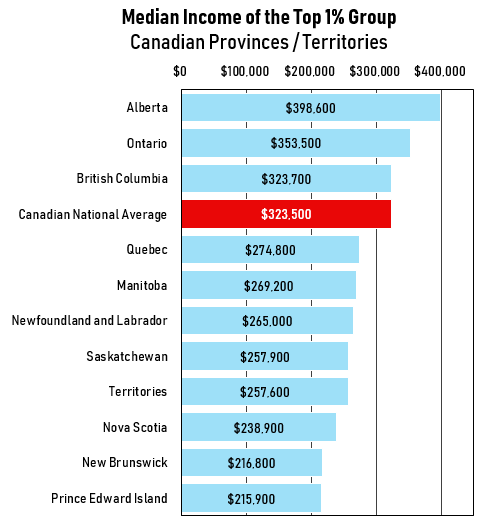
The top 1% of Canadians earned a median income of $323,500 in 2017, compared against a median income of $35,100 across the country as a whole.
The bottom 50% of Canadians earned a median annual income of only $17,800.
So… what’s a middle class income in Canada? How about an upper middle class income?
While nearly 70% of Canadians consider themselves to be “middle class”, we have to draw lines in the sand somewhere!
Everyone can have (and is entitled to) their own opinion on the matter, but I’ll offer my two cents based on the data above:
- A Canadian is “middle class” if they earn an income of at least $35,000 per year — corresponding to the threshold to join the top 50% of Canadians
- A Canadian is “upper middle class” if they earn at least $100,000 per year — i.e., the top 10% of Canadians
- The “upper class” range starts at an income of $236,000 per year — only 1% of Canadians exceed this mark
Canadian Income Inequality
Our next chart gives a sense for the state of income inequality in Canada.
The areas of the boxes in the first column show the relative size of each group in terms of population.
Meanwhile, the areas of the boxes in the second column show the share of overall national income controlled by that group.
(Click to expand the image in a new tab)
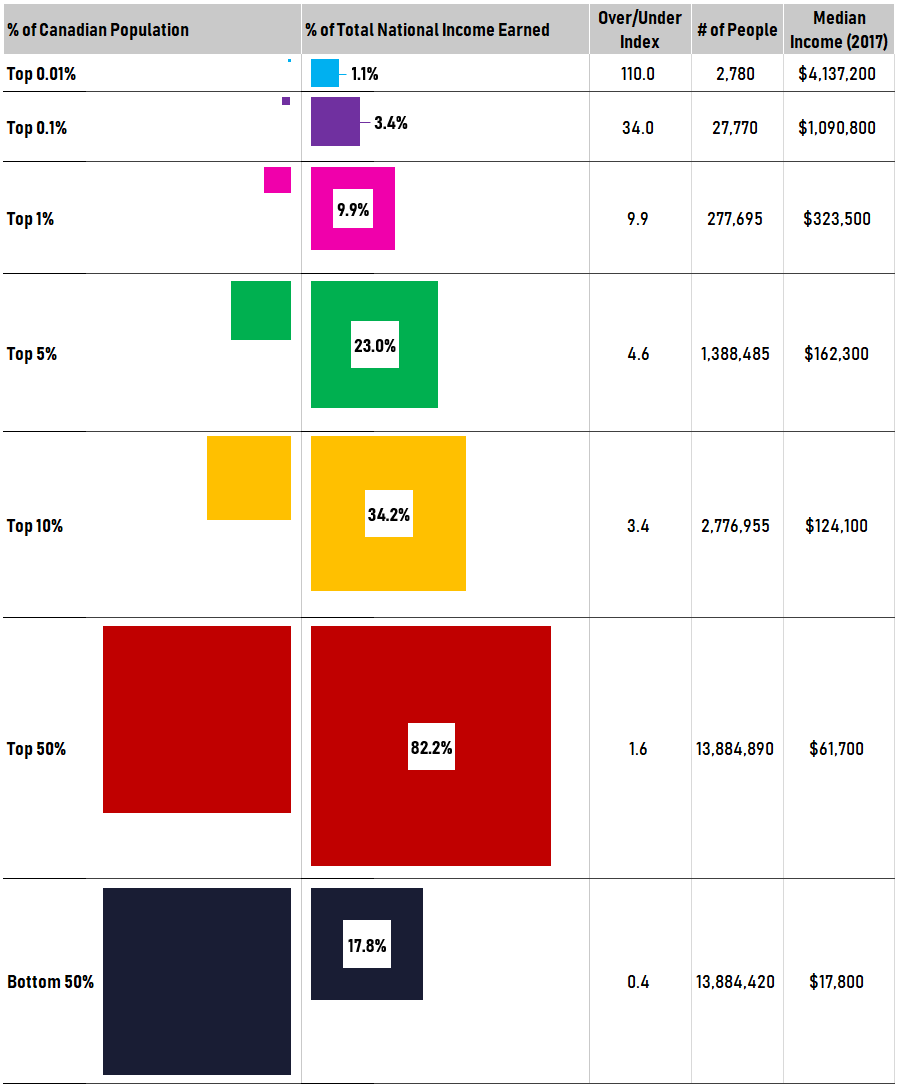
Let’s use the first row as an example. The top 0.01% group covers the 2,780 people in Canada who earned the highest incomes in the country.
Given the small size of the group (one hundredth of one percent of Canada’s total population), the bright blue box in the first column barely registers as a blip on the screen.
However, this group of Canadians earned an enormous amount of income in 2017 — with median income of $4.1 million per person! This group earned 1.1% of Canada’s total income in 2017.
This works out to an “over-indexing” factor of about 110 (since the group makes up only 0.01% of Canada’s population but earned 1.1% of Canada’s income).
In contrast, the bottom 50% of Canadians only earned 17.8% of Canada’s national income and is thus “under-indexed” on the income-to-population ratio.
Long story short — the Canadians at the top of the income pyramid earn significantly more than those in the middle or bottom of the stack. I’m sure that this comes as a surprise to just about no one.
But has it always been this way? The next chart shows the ratio of income earned by Canada’s top 1% versus the income earned by the average Canadian, from 1982 to 2017.
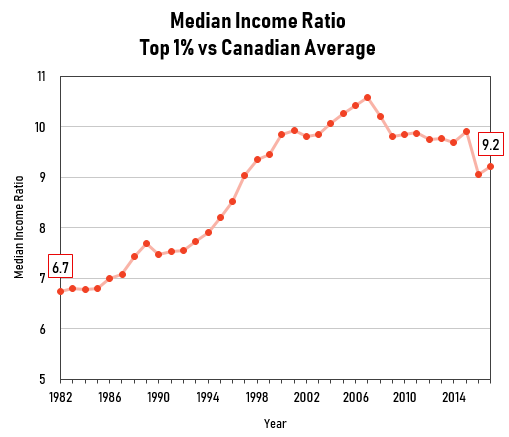
In 2017, the median top 1% Canadian earned an income of $323,500, compared to $35,100 across all Canadians — implying that people in the top 1% earned 9.2 times more income than the average Canadian.
By this metric, we can see that in general, income inequality has increased from the 1980’s to today.
For sake of comparison, in 1982, Canada’s top 1% earned 6.7 times more income versus the average Canadian ($214,483 versus $31,828, in inflation-adjusted 2017 dollars).
However, it’s also worth noting that ‘top 1% vs Canadian average’ income ratio has actually decreased from 2007, when it stood at a high of 10.6.
Income Taxes Paid by High-Income Canadians
The next few charts show how the share of income earned by each group compares against the income taxes paid by that group, and the tax rates paid by each group.
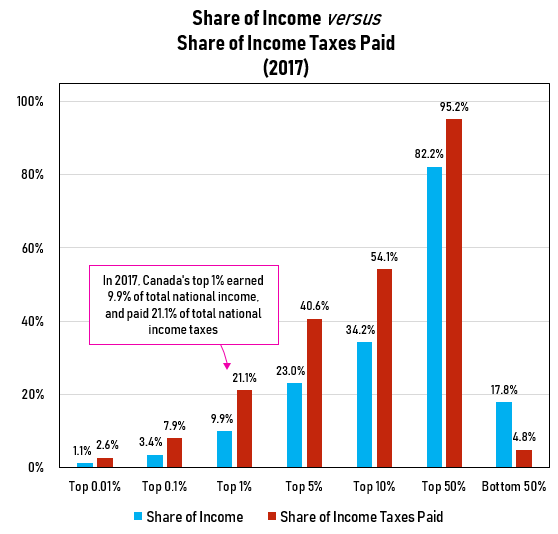
Canada uses a “progressive tax system”, meaning that as you make more money, the income tax rate that you pay also increases.
Putting this in more concrete terms, and using figures from the chart above:
- The top 1% earned 9.9% of Canada’s total income, and paid 21.1% of Canada’s total income taxes
- The top 10% earned 34.2% of Canada’s total income, while paying more than half of Canada’s total income taxes (54.1% to be exact)
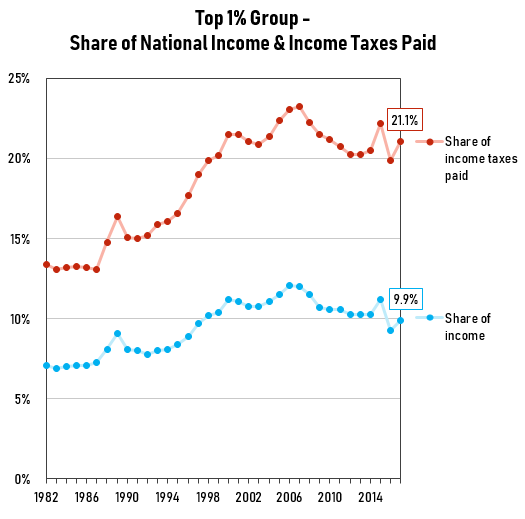
Over the last few decades, this general pattern has held firm. As you can see below, the share of taxes paid by the top 1% has been roughly double their share of income earned.
To visualize Canada’s progressive income tax system at work, the next chart shows the effective income tax rates paid by each of the groups.
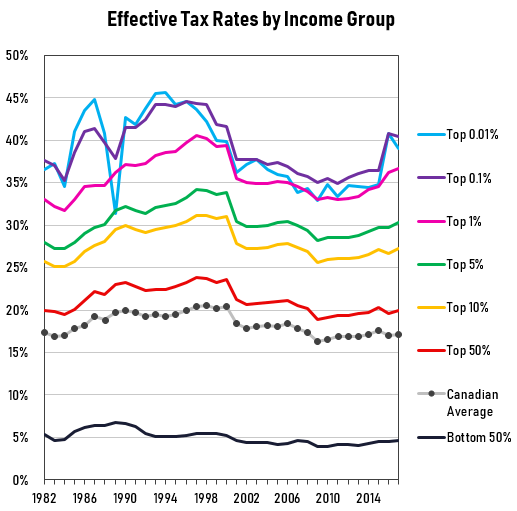
Canada’s highest income earners — those in the top 10% — are paying effective tax rates of 25% to 40%.
In contrast, the bottom 50% pays an income tax rate of roughly 5%.
Across all Canadians, the average tax rate has hovered around the 15% to 20% range.
Female Percentage of High-Income Canadians
The StatsCan dataset also provides a fascinating glimpse into how the male vs female split of Canada’s highest income earners has changed over time.
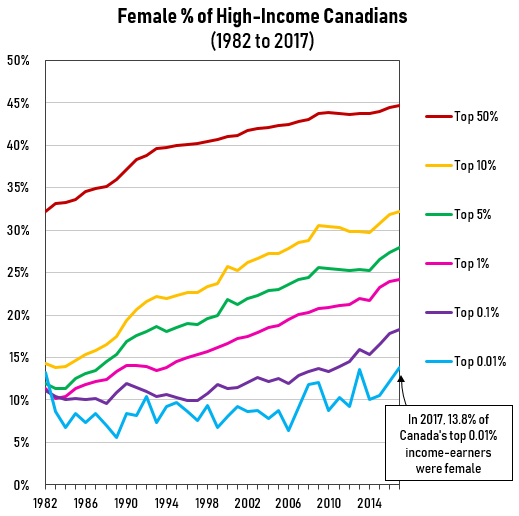
Across all income groups, the numbers are trending closer to a 50-50 split as time passes.
For example: in 1982, only 10% of Canada’s top 1% were women.
Fast forward to 2017, and women now make up nearly 25% of Canada’s one-percenters.
Joining the 1% Club – From Coast to Coast to Coast
In a country as large and diverse as Canada, relying on broad ‘national average’ metrics doesn’t do justice to the differences between individual regions (Toronto vs Saskatoon, Quebec vs BC, etc).
To that end, the following charts dig into the nitty-gritty regional details, giving us a sense for what it means to be in the top 1% in major cities around the country, and across all provinces / territories.
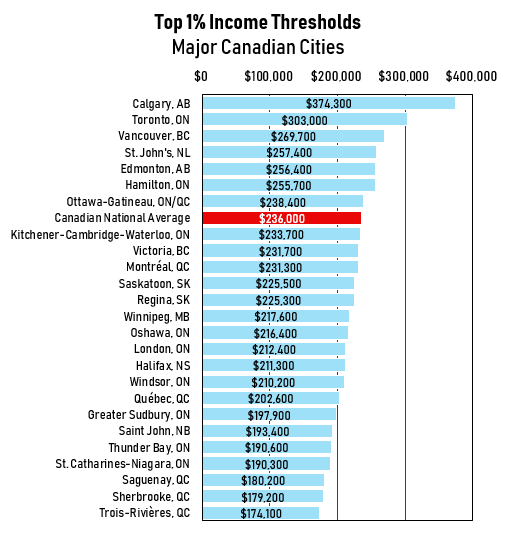
To break into the top 1% of all Canadians, you’d need an income of at least $236,000.
However, joining the 1% club in Calgary would require an income of at least $374,300.
On the other end of the spectrum, a top 1%er in Trois-Rivières would “only” need to earn an income of $174,100.
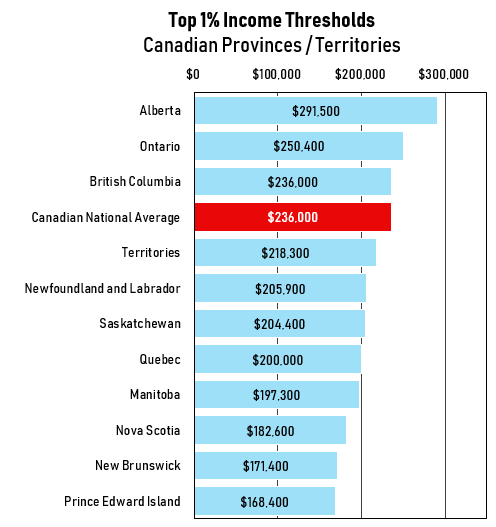
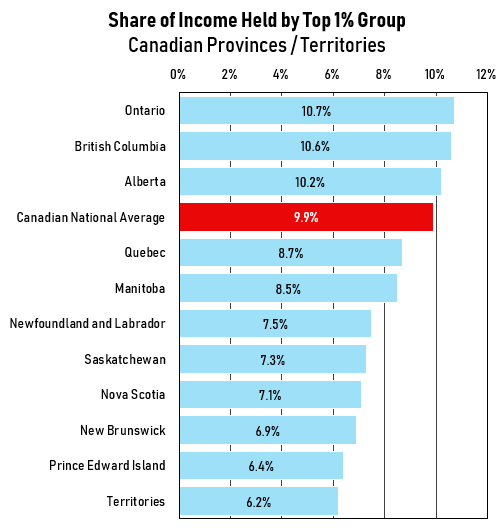
Taking a province or territory view largely shows the same story.
Incomes are relatively higher in AB / ON / BC, and relatively lower in the rest of the country (Atlantic Canada / QC / MB / SK / the Territories).
The next two charts show the median incomes earned by the top 1% (the income earned by a person in the middle of the group).
First up is the data shown by major city, and second by province / territory.
The final set of charts shows the share of income earned by the top 1%.
These charts give us a sense for the inequality of income in different regions across the country.
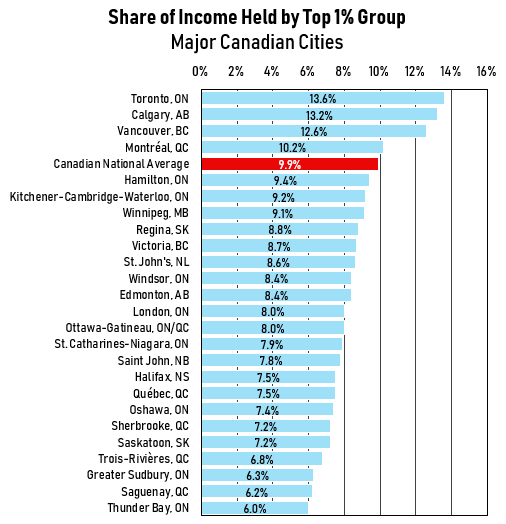
The top 1% controls the highest share of income in the urban hubs of Toronto, Calgary, Vancouver, and Montréal.
Final Thoughts
And that’s all for now! After getting through that barrage of data, I’d be curious to hear your thoughts:
- Do high-income Canadians pay too little or too much in income taxes… and why?
- If you considered yourself to be a part of the middle class at the start of this, do you still feel the same way?
If you’d like to share your thoughts, you can do so in the comments below, or through email at themeasureofaplan@gmail.com
—
If you’d like to continue exploring through this dataset, feel free to check out:
My spreadsheet, containing all of the source data and charts displayed in this article (download here).
Statistics Canada Sources:
- High income tax filers in Canada
- High income tax filers in Canada – specific geographic area thresholds
- Canadian Consumer Price Index — used for inflation adjustments
—
Header image credit: Maria Hergueta
I’d consider myself middle class if i could own a home. Which means I’d be middle class in a lot of places. But I live in toronto, so all i can do is rent.
Bob, that strikes me as a very reasonable definition. Unfortunately a tough reality for those living in Toronto, Vancouver, Calgary (amongst other places).
That was an entertaining & educational post, great work! Two things that stuck out to me…
1) For the richest Canadians in the top 0.01% group, the share of women hasn’t really increased from the 1980’s to today. Hopefully that will change in the future
2) Income inequality seems to be lower in rural cities across the country
Again, really good stuff!
Thanks Dana, great insights. Yes I am very curious to see how the male/female split of the top income group changes in the years to come.
I think this won’t happen unless women learn to be competetive. The need to get into sports more at young age and learn the habit of competing and winning. That’s where men pickup their competitive edge. Or we have to move to a more matriachical society. Where men at early age are asked to do household chores and share the load of family. Gotta choose one as a society. Let’s go
In the chart showing the effective tax rates, it seems the offset between the 10%, 5% and 1% has all remained fairly constant over time. However, the offset for the 0.1% got a lot closer to the 1% line around the year 2000, so these wealthy people are no longer carrying as much of the tax burden as they used to. Worse still, the rate for the increadibly wealthy 2800 people in the 0.01% is no higher than for the 0.1% (and is often lower!). Shouldn’t people earning >$3M in 2017 have to pay taxes at a higher rate than the “poorer” people below them? That would seem like a progressive approach to taxation.
Rob, that’s a great observation.
I had seen that in the data as well (whereby the top 0.01% sometimes have lower tax rates versus the top 0.1%), and don’t have a good explanation for why that is…
My first thought was that this was caused by capital gains, given that people with higher incomes tend to have a greater portion of their income derived from capital gains (which are taxed at a lower rate vs employment income).
However, upon further digging I found that the StatsCan source that I am using for income does not include income from capital gains “because [capital gains] are not by their nature regular and recurring. It is further assumed that they are more relevant to the concept of wealth than the concept of income”.
https://www12.statcan.gc.ca/census-recensement/2016/ref/dict/pop123-eng.cfm
I suspect it is a function of the percentage of income from eligible dividends among the top income group, which dividends are taxed in the individuals’ hands at preferential rates relative to straight income, because the dividend payor has already paid 26.5% tax on the distributed funds.
In any case, given that the cutoff for the top 0.1% and the top 0.01% are both well above the thresholder for the top marginal tax rate, it should not be a surprise that their effective tax rates are comparable.
Thanks Brandon, that’s a great point!
Great article and Q&A.
I just like to add that your initial instinct is probably correct, although not in the ordinary sense.
Most of these very high income earners probably got a large portion of their income paid out as stock options. The difference of the exercise price of these options and their market price at the time of exercise is considered an employment benefit, and included in their T4 employment income amounts. However, the “inclusion rate” for such income is the same as the capital gains inclusion rate (i.e. 50% at present).
I believe this “reduction” was new around 1999-2000; hence it should explain the observation.
Your statement that “income inequality has increased from the 1980s to today” is based on a measure of change of a very small subset of the population. If you had compared the change in the top 1% to the top 50% it would show a much smaller difference.
The generally accepted measure of income equality is the Gini coefficient. Canada’s Gini number is 34 which is close to the average for highly developed countries except the USA with a Gini number of 42. Gini numbers have been gradually increasing world wide since the 80s. Too many Canadians are influenced by information from the US which has a serious inequality problem. We don’t.
Hi Gregor,
Agreed that my measure is just a proxy based on a small portion of the population.
However, I believe that my statement still holds true when using the gini coefficient metric as well.
From another source:
https://www.conferenceboard.ca/hcp/Details/society/income-inequality.aspx?AspxAutoDetectCookieSupport=1
“Income inequality in Canada has increased over the past 20 years. Canada reduced inequality in the 1980s, with the Gini coefficient reaching a low of 0.281 in 1989. Income inequality rose in the 1990s, but has remained around 0.32 in the 2000s.”
My statement was comparing the Canada of the past with Canada today, in which inequality has indeed increased. It was not meant to be a comparison between the state of inequality in Canada vs the US.
Hello there,
I thoroughly enjoyed reading your recent post and have shared with many friends who have responded with equal enthusiasm.
I’d like to double check and ask you to clarify one critical piece of info here, if you can…
Can you clarify what “income” number you are using as the basis for all your income amounts in this report?
What line of the typical tax return are you using to indicate income?
Is this the “total” income
Or the “net” income (which is calculated before taxes, but after various deductions like union dues and RRSP payments etc.)
Or the “taxable” income
Hopefully this makes sense. Thanks in advance for whatever clarification you can provide.
All the best.
Hi Kevin, thanks for your comment.
The income figures are pre-tax amounts.
These figures are based on the “total income” definition used by StatsCan, and consists of income from earnings, investments, pensions, spousal support payments, government transfers, refundable tax credits, and other taxable income.
Capital gains have been excluded because “because they are not by their nature regular and recurring. It is further assumed that they are more relevant to the concept of wealth than the concept of income”.
StatsCan source here:
https://www12.statcan.gc.ca/census-recensement/2016/ref/dict/pop123-eng.cfm
Good afternoon re: top 1 pct
Do the stats also include share options in total income?
Thanks
Hi Robert,
The income values used for this analysis are provided by Stats Can, and are based on Stats Can’s “Total Income” definition.
https://www12.statcan.gc.ca/census-recensement/2016/ref/dict/pop123-eng.cfm
“The monetary receipts included are those that tend to be of a regular and recurring nature. Receipts that are included as income are:
– employment income from wages, salaries, tips, commissions and net income from self-employment (for both unincorporated farm and non-farm activities);
– income from investment sources, such as dividends and interest on bonds, accounts, guaranteed investment certificates (GICs) and mutual funds;
– income from employer and personal pension sources, such as private pensions and payments from annuities and registered retirement income funds (RRIFs);
– other regular cash income, such as child support payments received, spousal support payments (alimony) received and scholarships;
income from government sources, such as social assistance, child benefits, Employment Insurance benefits, Old Age Security benefits, Canada Pension Plan and Québec Pension Plan benefits and disability income.
Receipts excluded from this income definition are:
– one-time receipts, such as lottery winnings, gambling winnings, cash inheritances, lump-sum insurance settlements and tax-free savings account (TFSA) or registered retirement savings plan (RRSP) withdrawals;
– capital gains because they are not by their nature regular and recurring. It is further assumed that they are more relevant to the concept of wealth than the concept of income;
employers’ contributions to registered pension plans, Canada Pension Plan, Québec Pension Plan and Employment Insurance;
– voluntary inter-household transfers, imputed rent, goods and services produced for barter and goods produced for own consumption.”
Unfortunately from the text above, it’s not clear to me if share options have been included or not.
Great blog. I believe Stock Option income is simply considered income from employment despite not being specifically noted.
Good to know, thanks David!
I consider myself as upper class. My yearly income is about 600,000$. I own 3 condos in toronto, Kitchener and vancouver. My kids have a nany and they go to a top privet school in toronto. Let me get to the point, I like to vist these websites because I want to fined out where I stand. I want to know where I stand because my husband tells me that he wants to know if we are in the top 1%. I ask that you please get back to me in an hour; or I will go to a different website.
Thanks.
” To break into the top 1% of all Canadians, you’d need an income of at least $236,000.
However, joining the 1% club in Calgary would require an income of at least $374,300.
On the other end of the spectrum, a top 1%er in Trois-Rivières would “only” need to earn an income of $174,100. “
Sarcasm Jayden… I like it!
I am a 36 with a net assets of 1.6M and still live and feel like a lower middle class. We cook every meal and only buy groceries on sales and drive Hondas. The best wealth is to stay hidden and live below your mean.
Stealth wealth — a sensible strategy!
This was a great article! Here’s my question: this seems to look solely at individual incomes, rather than household. Is there a similar analysis somewhere of household income?
Thanks Bruce.
Check out this StatsCan data which has household income data from the 2016 census:
https://www12.statcan.gc.ca/census-recensement/2016/dp-pd/hlt-fst/inc-rev/Table.cfm?Lang=Eng&T=102&PR=0&D1=1&RPP=25&SR=1&S=108&O=D
For example, the median pre-tax household income in Toronto is $78,373.
[…] https://themeasureofaplan.com/high-income-canadians/ 8 […]
Great article! It will be good also to have data on wealth and not just income. CRA seems to consider income only and not wealth. Some one who has a million dollar home and another million dollar in RRSP might report as having zero income, and paid little taxes. Or if they are retired, be entitled to OAS and GIS.
Thanks Jimmy — agreed that would be interesting. If I can find some good data on that I’ll consider a new post!
Great article to read indeed. I have a quick question about this calculation. I have an incorporated business which generates about $1.2M net income annually however, I and my spouse only withdraw about $300,000 as dividend/salary because that’s pretty much all we need to sustain our living. Rest I leave it in business account due to tax saving purpose. In this case, will my household income be calculated as $300,000? If so, this top 0.01% or 0.1% are not quite accurate as it seems because I know many high profile individuals who do the same as I do. I would like to know if those incorporation income taxes are factored in. Thanks for your input.
Hey Tyler;
My understanding is that the data reflects personal/individual income. Funds that remain in your business are not realized income to you as an individual. Essentially this is equity, just like the value of a persons home is not income. Your business dollars would be a measure of wealth, but not income.
If by demonizing the 0.1% you think that by increasing their taxes will make things better for the middle class you don’t know what it takes to be in that category. To get into this category many transactions between many people must occur, this takes a lot of labour as no person can do this alone. In this category you will find primarily business people often with higher education, but not exclusively this category. More risk and reward is often taken, therefore pre selecting men in this type of occupation. What might make things better would be to lower taxes on this group and use policy to stop the globalization of many Canadian industries. The more that you tax the 0.1% the more that they jump ship. These are the facts of this data set.
Interesting article. It would also be interesting to look at just earned income and restrict the population to those with income related to employment and self employment. I expect the median earned income would be different than the median total income because retirees are not included.