October 9th, 2024 | Posted in Data & Insights

This post analyses Canadian income, spending, cash flow, and net worth — putting a spotlight on the financial gap between Canadians at the high and low ends of the spectrum. To explore the data beyond a simple broad average, we’ll split the data into a quintile distribution, and also a breakdown by age group.
We’ll use this data to answer questions such as:
- What is the after-tax income of the richest and poorest Canadian households?
- How much do Canadians save per year? How does this vary for the top 20% and bottom 20% of households?
- Has the Canadian inequality gap increased or decreased over time?
- What is the average Canadian net worth, and how has it changed over time?
The data covers 25 years (from 1999 to 2023), and is sourced from Statistics Canada.
Note: throughout this analysis the data is broken down into income “quintiles”. This means that Canadian households have been ranked from low-to-high based on their income, and then divided into 5 groups.
“Quintile 1” refers to the bottom 20% of households, while “Quintile 5” refers to the top 20% of households. Quintiles 2/3/4 represent the middle 60% of the distribution.
Canadian Household Income / Spending / Cash Flow by Quintile (2023)
As of 2023, the average Canadian household earns $96,406 per year (in after-tax income) and spends $93,707 per year, yielding cash flow of $2,699 per year which can be saved / invested.
Put another way, the average Canadian household saves ~3% of their post-tax income per year.
However, as we’ll see below, the simple average doesn’t show the nuances of the story. We can get better insights by breaking down the data into age groups and quintiles (lower income vs. higher income buckets).
The tool below lets you explore the quintile distribution for one age group at a time (use the drop-down menu to change age groups).
Chart created by: The Measure of a Plan
Note: quintile 1 = bottom 20% of incomes, while quintile 5 = top 20% of incomes
Canadians at the high vs. low end of the distribution have vastly different financial positions:
- The top 20% of households (quintile 5, all age groups) are earning $197,667 per year in after-tax income, and have positive cash flow of $60,652 per year
- The bottom 20% of households (quintile 1, all age groups) are earning $31,604 per year in after-tax income, and have negative cash flow of $30,364 per year
- ~60% of Canadian households had negative cash flow in 2023 (i.e., their total spending exceeded their total income in the year)
The top-end of Canadian households are managing to save/invest in real estate, stocks, and other financial assets. Meanwhile, a large share of households are struggling to keep up with the high cost of housing and food in Canada.
While the dataset doesn’t contain details about how Canadians are dealing with negative cash flow situations, we can speculate that lower-income households may be sustaining their lifestyles by taking on debt (line of credit, student loans, credit cards), receiving financial support from family, and by drawing down on their savings balance.
A spring 2024 survey conducted by Statistics Canada showed that lower-income Canadian households are facing increasing financial strain. A few key quotes below:
“In spring 2024, nearly half (45%) of Canadians reported that rising prices were greatly affecting their ability to meet day-to-day expenses, 12 percentage points higher than what it was two years earlier (33%).”
“Concerns about housing affordability increased over the past two years. In spring 2024, nearly 4 in 10 Canadians (38%) reported being very concerned with their ability to afford housing or rent because of rising housing prices, compared with 3 in 10 (30%) in the spring of 2022.”
“In spring 2024, nearly 6 in 10 of people in the lowest income quintile (59%) and about half of those in the second (52%) and third (48%) income quintiles reported that rising prices greatly affected their ability to meet day-to-day expenses. By comparison, just over one-quarter (27%) of those in the highest income quintile reported experiencing these impacts.”
To cope with record-high housing / living costs, Canadians are increasingly relying on debt financing. Indeed, Canada’s household debt to GDP ratio is the highest among G7 countries.
Canadian Household Cash Flow By Quintile (1999 to 2023)
The chart below shows household cash flow by quintile, over the period of 1999 to 2023 (for all age groups combined).
As a reminder, cash flow is defined as household after-tax income minus household spending. A negative value indicates that a household’s spending exceeded their income in the year.
The data has been adjusted for the impact of inflation, with all values showing 2023 dollars.
Chart created by: The Measure of a Plan
Note: quintile 1 = bottom 20% of incomes, while quintile 5 = top 20% of incomes
This metric shows that economic inequality has gotten worse over time, with the gap between high/low income-earners widening over the past 25 years.
- In 2023, the top 20% of Canadian households (quintile 5) had cash flow of $60,652, compared to negative cash flow of $30,364 for the bottom 20% (quintile 1). This implies a cash flow gap of $91,106 between the richest and poorest Canadians
- In 1999, the cash flow gap was $45,398
- Over 25 years, the gap in savings power between rich and poor Canadians has doubled
Distribution of Canadian Household Net Worth
Thus far we’ve looked at data on Canadian income, spending, and cash flow — amounts generated within a single year. Next, we’ll turn our attention to net worth, the cumulative balance of total assets minus total debts.
The chart below shows average Canadian household net worth by quintile, comparing 2010 versus 2023 values.
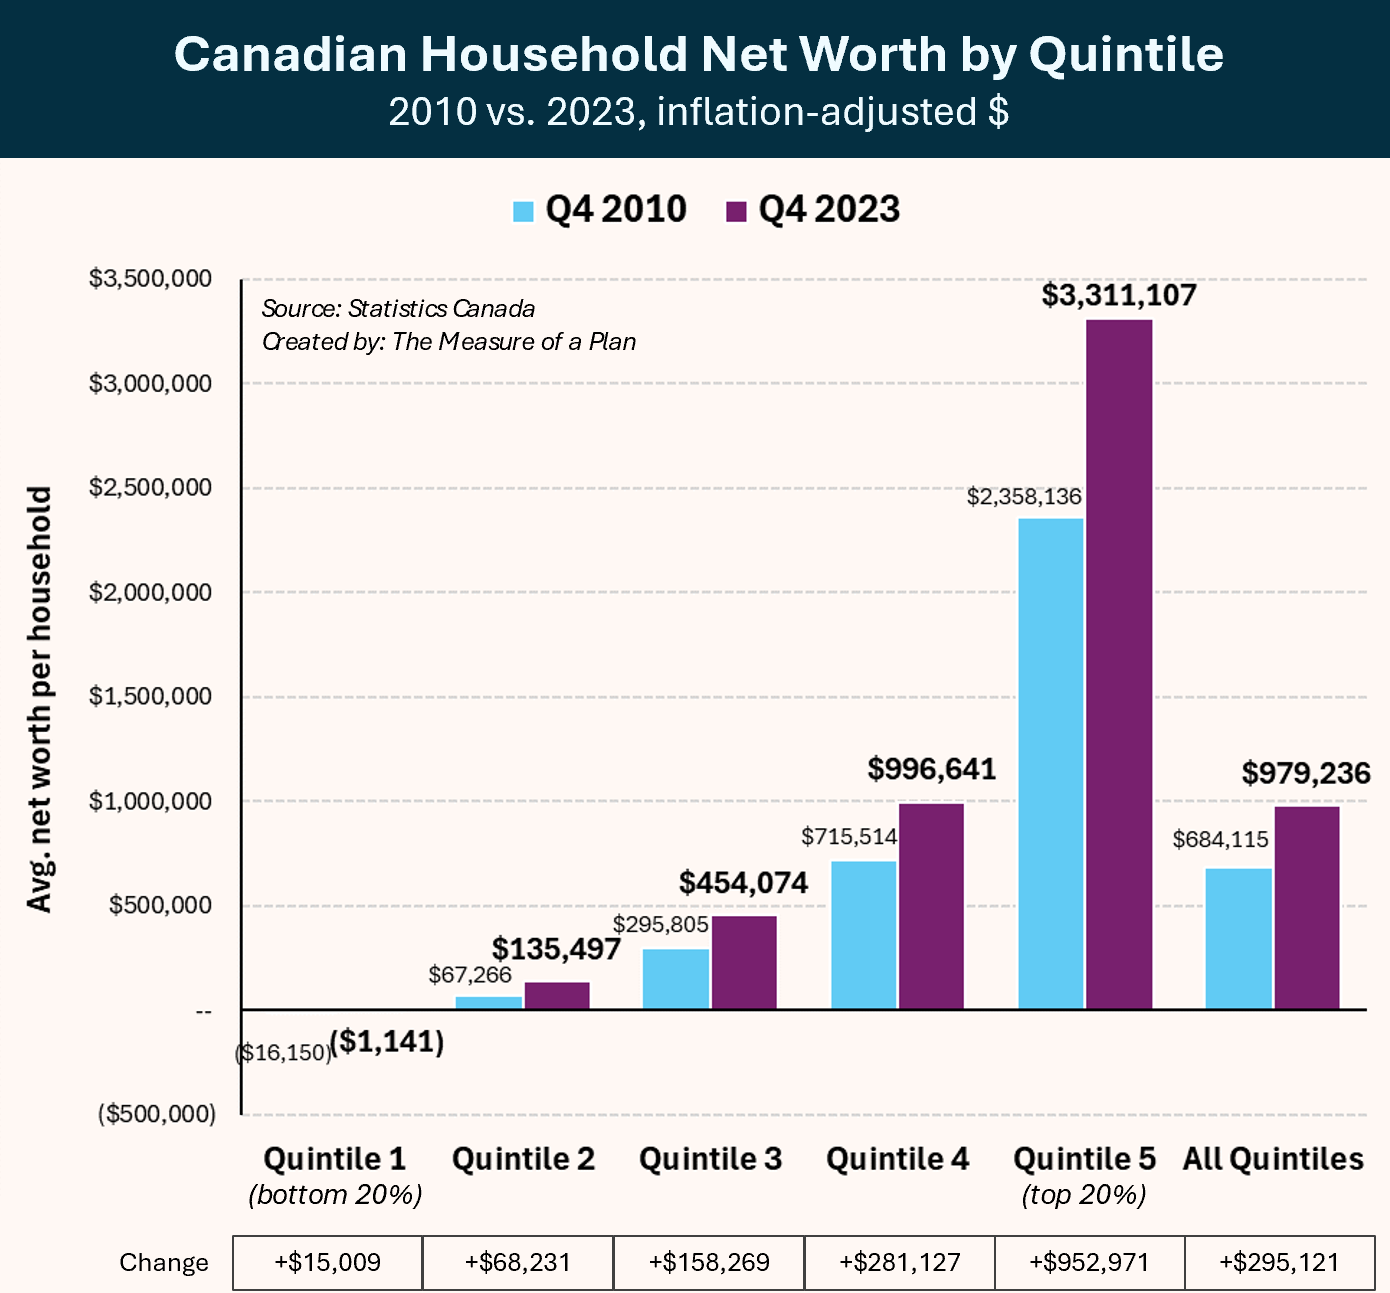
Note: these quintiles are based on household net worth, as opposed to household income as shown in the previous charts
While the average Canadian household had a net worth of $979,236 in 2023, this simple average once again masks important nuances.
- The wealthiest 20% of Canadian households had an average net worth of ~$3.3 million in 2023, an increase of nearly $1 million versus 2010
- The poorest 20% of Canadian households had an average net worth of negative $1,141 in 2023, an increase of $15,009 versus 2010
The richest Canadians are in a position to save money each year, allowing them to invest and compound their net worth over time.
On the other hand, the poorest Canadians are struggling to keep up with day-to-day living expenses, challenging their ability to invest and grow their wealth.
Sources, Notes, and Closing Remarks
The data was sourced from Statistics Canada:
- Distributions of household economic accounts, income, consumption and saving, by characteristic, annual
- Distributions of household economic accounts, wealth, by characteristic, Canada, quarterly
- Consumer Price Index, annual average, not seasonally adjusted
A few key notes and precisions about the Statistics Canada dataset
- The income value reported by Statistics Canada is net of taxes paid, includes government benefits received, and also includes investment income / interest received, offset by interest paid
- The spending value reported by Statistics Canada includes the concept of “gross imputed rent” in the definition of housing costs, which means that an estimated market rent expense is included for households that own their homes
- The “cash flow” metric shown in this post is defined as after-tax income minus spending, and does not include changes in pension entitlements. The pension value has been excluded as Statistics Canada does not report this value for age group quintiles
Statistics Canada provides detailed explanations of their data methodologies here.
These charts were created using the d3.js data visualization library.
If you liked this post, you may be interested in some of my other tools and data essays:
- Free spreadsheets and tools for budgeting, investment portfolio tracking, and more
- Tracking Canadian Housing Market Affordability (1999 to 2024)
- The Wealth of Nations: income, cost of living, and purchasing power for 110 countries
- Investment returns by asset class (1985 to 2024)
- US stock market returns — a history from the 1870s to 2023
That’s all for now! Thanks for joining me on this data deep dive 🧐. Feel free to drop any comments or questions below.
—
Header image by: Hanna Barczyk
Comment Section
Be the first to write a comment.