April 27th, 2024 | Posted in Data & Insights, Tools

[This post was originally published in Feb. 2023. The analysis has since been updated with 2023/2024 data in Apr. 2024]
This post digs into historical trends in the Canadian housing market using data on home prices, household incomes, and mortgage rates to paint a picture of housing affordability across the country.
The interactive tools below examine 14 major Canadian cities (Toronto, Montreal, Vancouver, Calgary, etc.), with data spanning the years of 1999 to 2024.
Multi-City Trends – 1999 to 2024
This is an interactive tool to explore the state of the Canadian real estate market across 6 indicators of housing affordability:
- Average home price by city
- Household incomes (pre-tax median income)
- Price-to-income ratio
- Implied monthly mortgage payment for new homebuyers
- Implied mortgage payment as a % of income
- “Qualifying” income (income required to buy the average home)
Pick an indicator from the drop-down menu below. Click the city labels in the chart to toggle them on/off. Hover over the lines for more details.
| Indicator: | |
| Adjust for inflation? |
Single City Spotlight – March 2024 Dashboard
Select a city from the drop-down menu — see the latest price / affordability indicators (together with comparisons versus the national average) in the table. See the annual % change in homes prices over time for your selected city in the chart.
| Location: |
| Data as of March 2024 | Average Home Price | Median Household Income | Price-to-Income Ratio |
|---|---|---|---|
| Value | x | y | z |
| Diff. vs national avg. | x | y | z |
| Notes | Price of the average home | Median pre-tax household income | Home price divided by pre-tax household income |
| Monthly Mortgage Payment | Mortgage as a % of Income | Qualifying Income | |
| Value | a | b | c |
| Diff. vs national avg. | a | b | c |
| Notes | Assumes 20% down payment, 25-year mortgage term, current 5-year fixed rate of 5.86% | Annual mortgage payment divided by annual pre-tax household income | Pre-tax income needed to support the implied mortgage payment, at 32% of income paid towards the mortgage |
Note: the % change in 2024 represents the year-to-date change as of March 2024.
Canadian Mortgage Rates Over Time – 1999 to 2024
To give further context to the trends seen above, here is data on Canadian average mortgage rates over time, from 1999 to 2024.
Mortgage rates are perhaps the single most important driver of changes in home prices. As mortgage rates fall, home prices typically rise. On the other hand, higher mortgage rates typically result in declining home prices. For example: from 2021 to 2024, mortage rates increased from ~3% to ~6%, while average home prices in Canada dropped by roughly 15%.
Other Trends and Takeaways
I’ll use this section to highlight a few pieces of data that I found interesting as I sifted through the data.
The Most Expensive & Least Expensive Cities in Canada
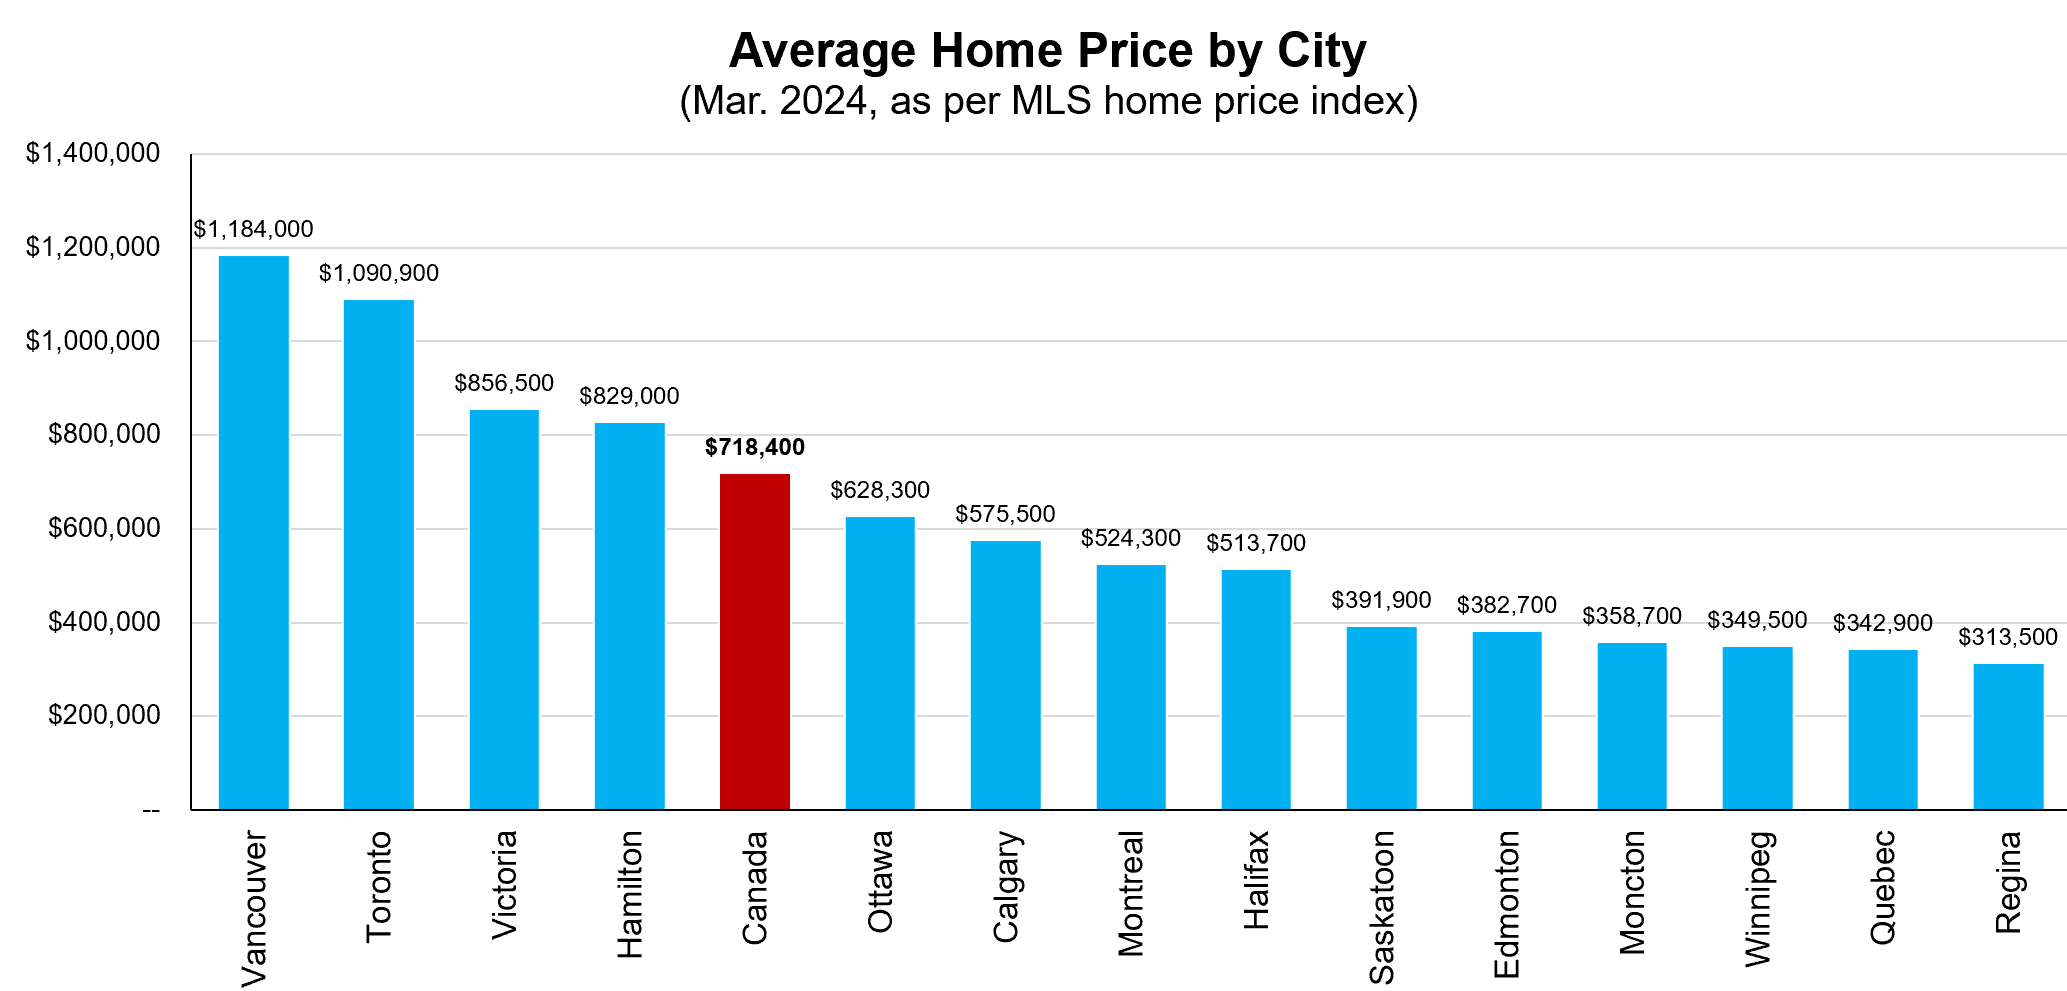
Cities with the most expensive homes (based on the average home price in March 2024 as per the MLS home price index):
- Vancouver: $1,184,000 (average home price)
- Toronto: $1,090,900
- Victoria: $856,500
- Hamilton: $829,000
- Ottawa: $628,300
Cities with the least expensive homes:
- Regina: $313,500
- Quebec City: $342,900
- Winnipeg: $349,500
- Moncton: $358,700
- Edmonton: $382,700
As of March 2024, the price of the average home in Canada is $718,400.
2023 Change in Canadian Home Prices
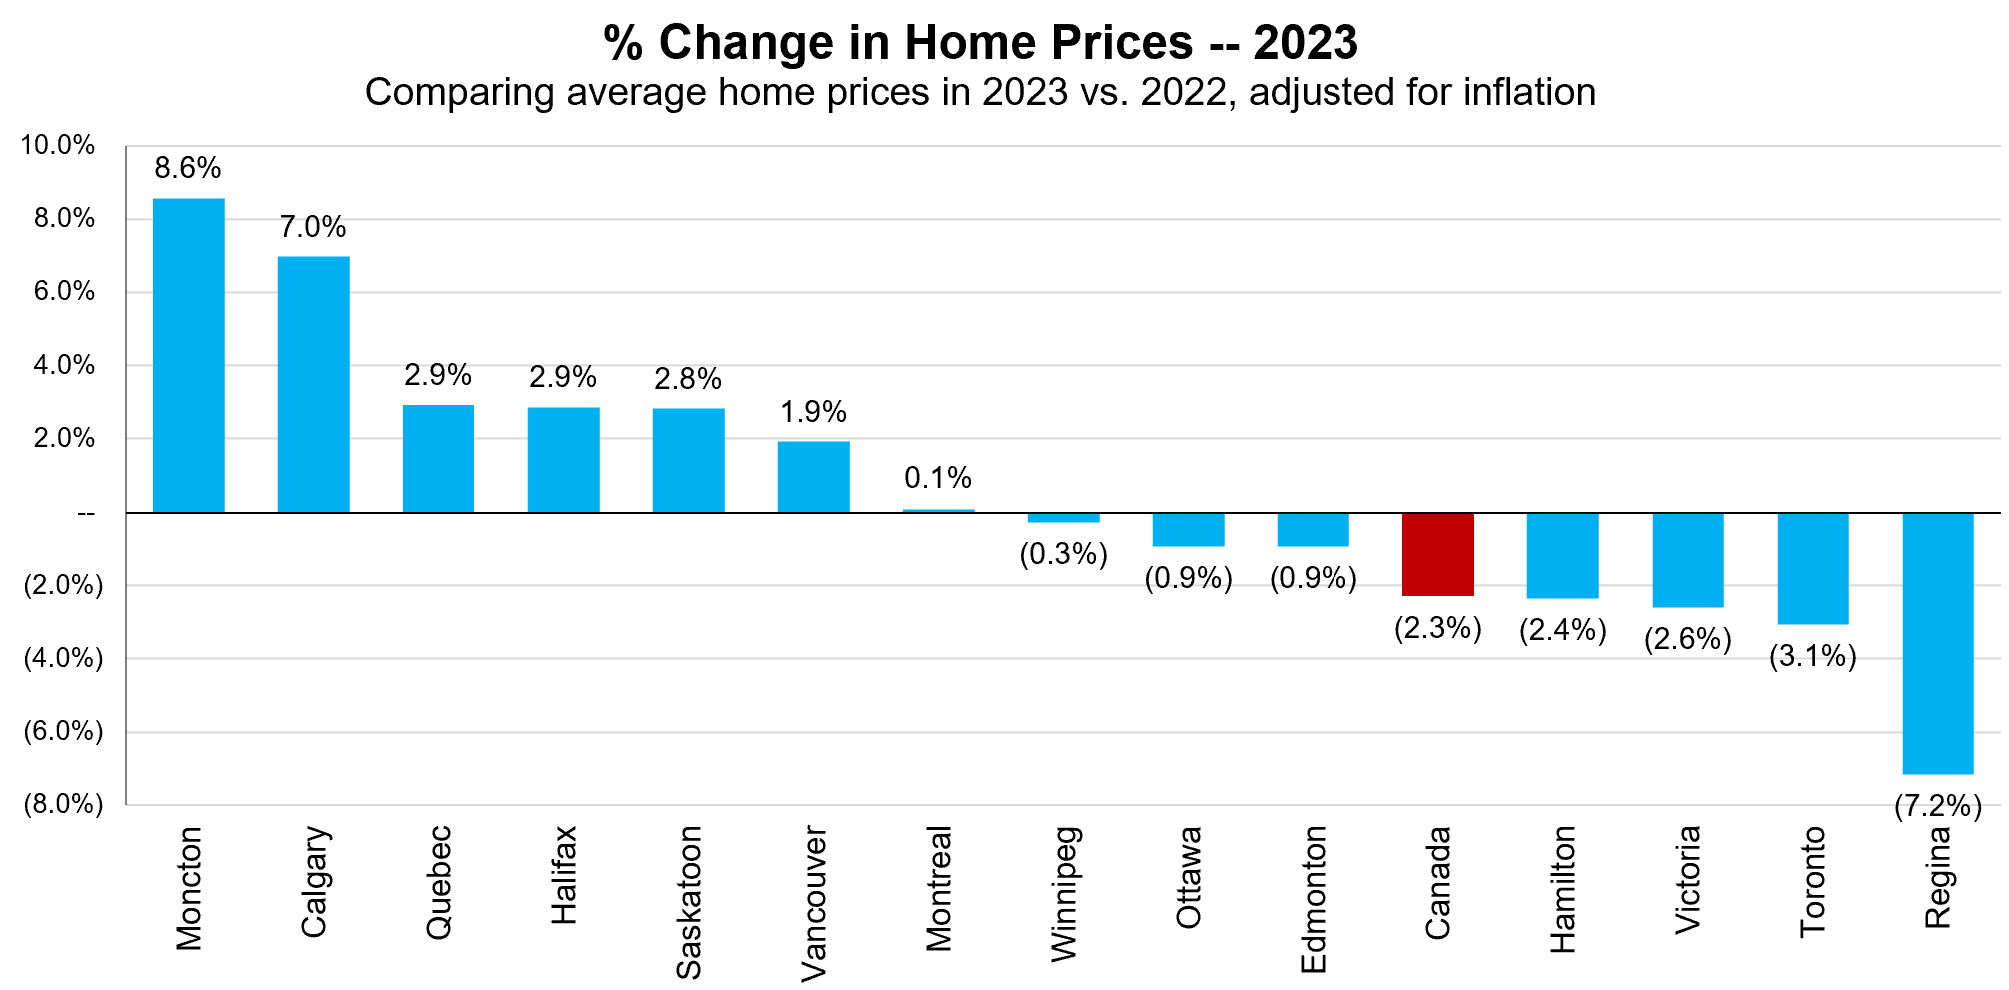
The chart above shows the % change in Canadian home prices by city in 2023, on an inflation-adjusted basis. Canadian real estate performance was a mixed bag in 2023, where home prices increased in 7 cities and dropped in 7 cities.
In 2023, home prices increased in the following cities:
- Moncton: +8.6% (versus 2022)
- Calgary: +7.0%
- Quebec City: +2.9%
- Halifax: +2.9%
- Saskatoon: +2.8%
- Vancouver: +1.9%
- Montreal: +0.1%
On the flip side, home prices dropped in 2023 in the following cities:
- Regina: -7.2% (versus 2022)
- Toronto: -3.1%
- Victoria: -2.6%
- Hamilton: -2.4%
- Edmonton: -0.9%
- Ottawa: -0.9%
- Winnipeg: -0.3%
How Much Have Canadian Home Prices Fallen By?
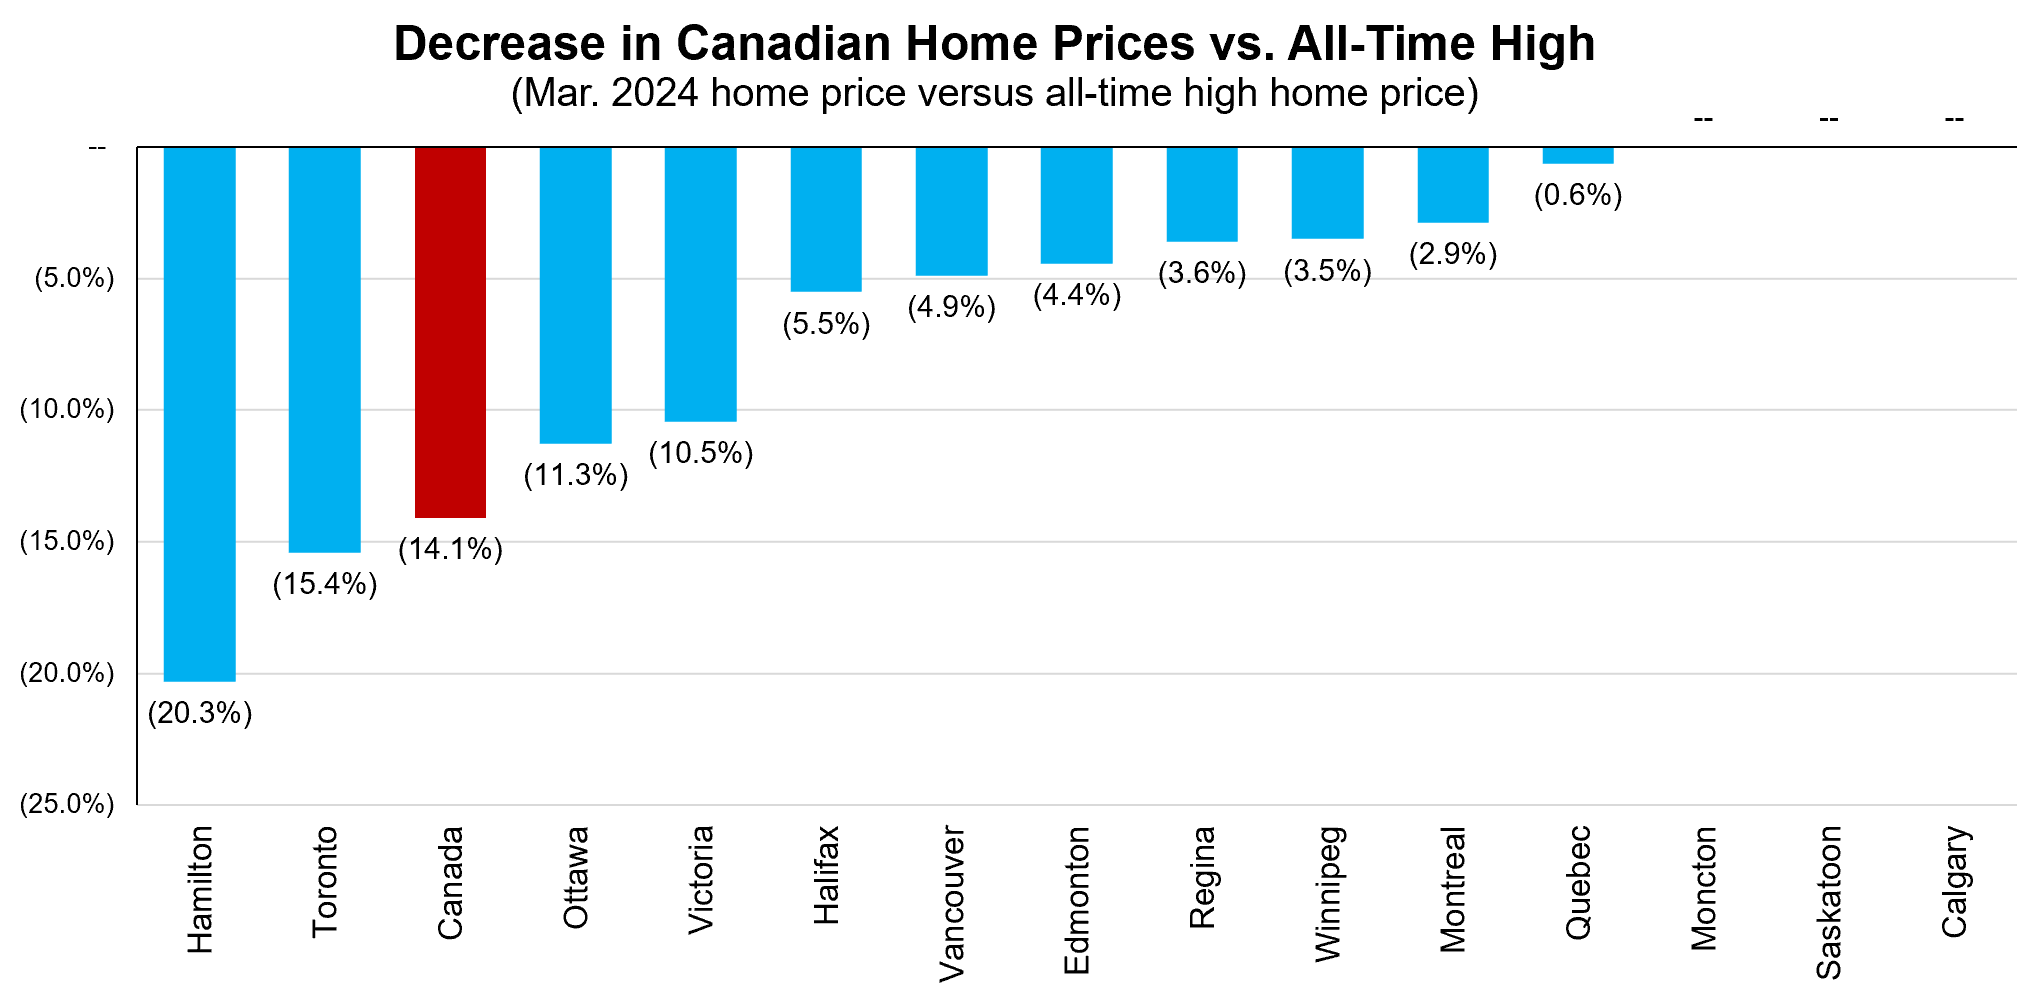
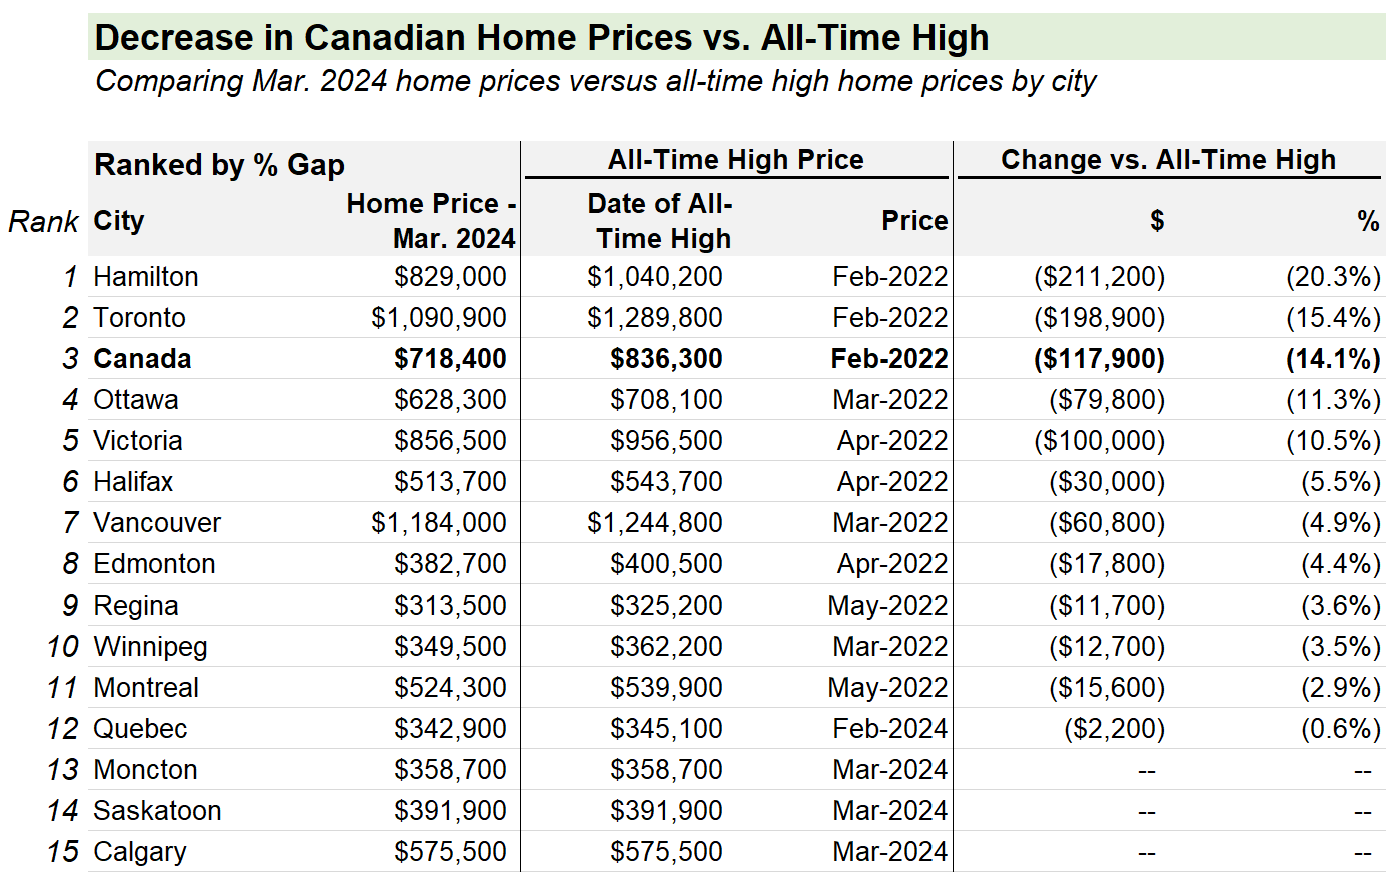
Across most cities in Canada, real estate prices peaked in Spring 2022, spurred on by a home buying spree during the pandemic. Since then, home prices have dropped in most major cities in Canada.
The most severe home price declines have been in Hamilton and Toronto, with current home prices roughly 15-20% lower than the all-time high price.
On the other hand, home prices in Calgary / Saskatoon / Moncton have continued to increase through 2023 and 2024, with home prices in those cities at all-time highs.
As of March 2024, the average home price in Canada has fallen by 14% (current price of $718,400 versus all-time high price of $836,300).
The Most Unafforable Cities in Canada
In spite of the recent declines in home prices in many cities across Canada, the housing market still remains unaffordable for most potential new homebuyers.
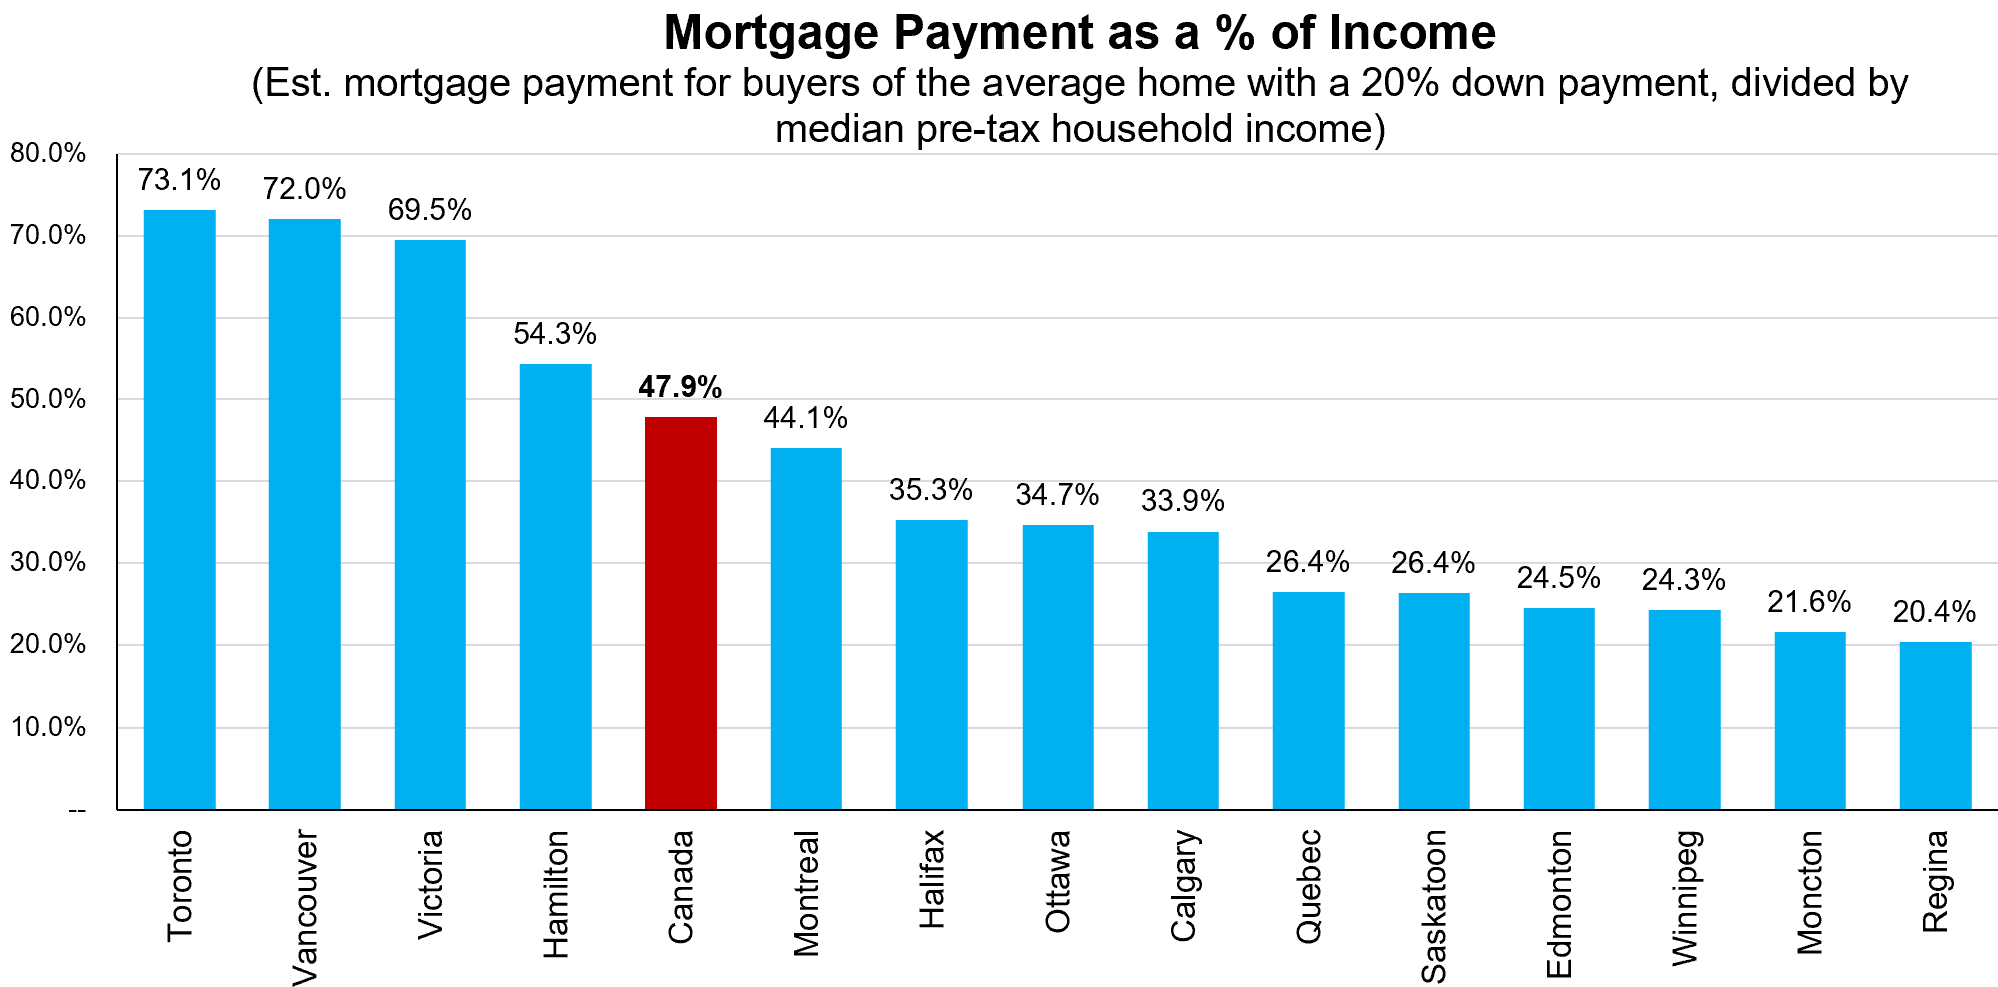
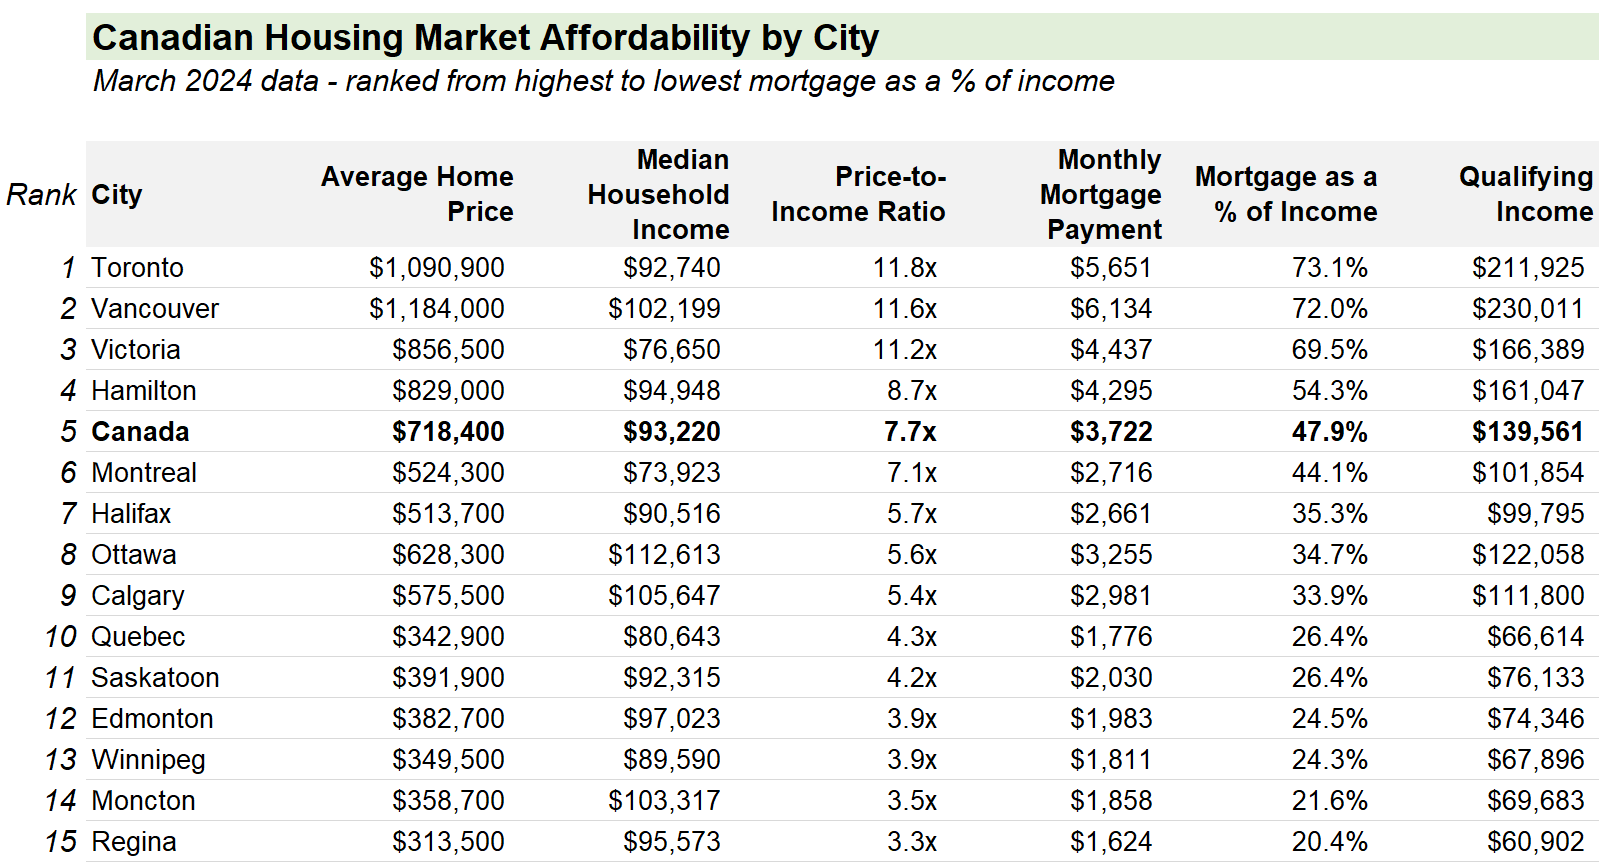
As of March 2024, a homebuyer who purchases the average home in Canada with a 20% downpayment at current mortgage rates would have a monthly mortgage payment of $3,722 per month ($44,664 per year). Compared to the median pre-tax household income of $93,220 in Canada, this means that the mortgage payment represents 47.9% of income.
Using this same measure of housing market affordability across Canada, the cities with the most unafforable housing are:
- Toronto: 73.1% of pre-tax household income paid towards mortgage
- Vancouver: 72.0%
- Victoria: 69.5%
- Hamilton: 54.3%
- Montreal: 44.1%
The average citizen cannot afford to buy the average home in these cities. Paying 50%+ of your pre-tax household income towards your mortgage simply is not financially viable.
Those who do manage to buy a home in these markets are often dual-income couples with incomes much higher than the average, and/or those fortunate enough to have parents helping to make a sizable downpayment.
On the other hand, these cities are the most affordable places to live in Canada:
- Regina: 20.4% of pre-tax household income paid towards mortgage
- Moncton: 21.6%
- Winnipeg: 24.3%
- Edmonton: 24.5%
- Saskatoon: 26.4%
Data Sources and Notes
The underlying data for this post came from a variety of sources noted below:
- Home prices (2005 to 2024): Canadian Real Estate Association – MLS home price index data, seasonally adjusted values
- Home prices (1999 to 2004): Teranet home price index
- Mortgage rates: Canadian Mortgage and Housing Corporation / StatCan – 5 year convential mortgage rate
- Household incomes: StatCan – 2020 household income by region, combined with monthly data on employment incomes by province
- Canadian inflation data: StatCan – consumer price index (all items), not seasonally adjusted
Related Reading
Other explorations into incomes, taxes, and the overall cost of living in Canada:
- Rent versus buy calculator — a spreadsheet to crunch the numbers on whether renting or buying is the better financial decision
- 2023 Canadian income tax calculator — a resource to compare tax rates and after-tax incomes across Canada
- Rent prices versus income in major Canadian cities
- Exploring Canadian incomes by province, age group, and sex
—–
Header illustration credit: Timothy Cook
Great work as usual. Highly informative.
Thanks Rob, much appreciated!
Great article. Where did you find the median household income date? if you could provide the source it’d be appreciated.
Thank you for your comment. I included a section about “Data Sources and Notes” near the bottom of this post. I included links to various data sources that I used for this analysis.
Cheers.
Under cities with the most and least expensive homes, Victoria is listed under both sections. Looks like Victoria should be Regina for least expensive.
Good catch — this has been fixed! Thanks very much Brenda 🙂
I loved your article on housing affordability. I really think you should add a button to easily share the article with others on social media and via other means.
Consider swapping Pre-Tax income with After Tax income. You cannot spend money on a mortgage payment if you never actually got it.
[…] every one personally. Questions and answers are edited for length and clarity.Charts of Canadian home prices by city from 1999 to 2023.The singer Bria and her band have been working through a series of […]
[…] Tracking Canadian Housing Market Affordability — data on Canadian home prices and affordability by city, from 1999 to 2023 […]
[…] Les prix des maisons canadiennes sont exceptionnellement élevés dans ses plus grandes villes, particulièrement Toronto et Vancouver, avec des ratios prix/revenu d’environ 12 X en moyenne. À titre de comparaison, le ratio […]
[…] amongst all 38 OCED countries. Canadian home prices are exceptionally high in its largest cities, particularly Toronto and Vancouver, with price-to-income ratios averaging around 12X. To compare, the “housing bubble […]
[…] to The Measure of a Plan, the house price-to-income ratio in Canada was 8 times in January this year, ranging from 12.1 […]
[…] every one personally. Questions and answers are edited for length and clarity.Charts of Canadian home prices by city from 1999 to 2023.The singer Bria and her band have been working through a series of […]
The best resource I’ve found to look at the state of the Canadian housing market by city – nicely done
[…] Tracking Canadian housing market affordability — analysing home prices, incomes, and mortgage rates across Canadian cities […]
I noticed that Newfoundland and Labrador are not included in these statistics . NL
[…] Tracking Canadian Housing Market Affordability (1999 to 2024) […]
Great article but unfortunately leaves out the vast area of Northern Ontario, cities bigger than Moncton and 400 to 1400 km from Toronto , Sudbury, T.Bay, North Bay. As usual, N.Ont an afterthought but the vastness of this area dwarfs Montreal to Hamilton. Throw us a bone….
[…] Tracking Canadian Housing Market Affordability (1999 to 2024) […]
[…] even worse, with 33% spending too much on rent, compared to 16.1% of homeowners. By March 2024, the average mortgage payment for a home was eating up almost half (47.9%) of the typical household’s income. In Toronto […]
[…] Source: The Measure of a Plan […]