May 4th, 2023 | Posted in Data & Insights, Tools
Canadians are increasingly confronted with sticker shock at the grocery store, with prices of common foods rising at a swift pace. Food price inflation has been one of the most concerning and persistent elements of Canada’s post-pandemic battle with inflation.
This post offers interactive tools which highlight prices across a variety of grocery store foods — from tracking price changes over time, to comparing prices by category, and beyond:
- What’s the average price for common grocery items like broccoli, chicken, or pasta?
- Which foods have increased in price the most (and the least) in recent years?
- How has the price of your average grocery shopping trip changed?
This analysis is based on a dataset published by Statistics Canada, which tracks the prices of 110 common grocery store food items, across the time period of 2017 to 2023. Let’s jump in!
Comparing Food Prices Changes by Category
Select a grocery category to explore (meat, vegetables, dairy, etc.). Use the slider to pick a time period. The tool will then display the percentage change in prices for common items in the category.
|
|
||
| Item | Starting Price | Ending Price | Change – $ | Change – % |
|---|
Tracking Food Prices Over Time 📈
Select up to 3 items using the drop-down menus below. You can also search by typing directly into the boxes to find a specific item (e.g., beef, lettuce).
|
|
|
|
|
|
|
|
| % Change in Price | A | B | C |
|---|---|---|---|
| 1-year | |||
| 2-years | |||
| 3-years | |||
| 4-years | |||
| 5-years | |||
| 6-years |
The Cost of Your Typical Grocery Trip 🛒
This tool estimates your “personal food inflation rate”. Use the drop-down menus to select foods that you typically buy at the grocery store. The chart will then show the price of your “basket” along with the change over time.
| Category | Item 1 | Item 2 | Item 3 |
|---|---|---|---|
| Meat / protein | |||
| Fresh vegetables | |||
| Fruit | |||
| Grain / carbs | |||
| Dairy | |||
| Pantry staples |
| Change in Basket Price | $ | % |
|---|---|---|
| 1-year | ||
| 2-years | ||
| 3-years | ||
| 4-years | ||
| 5-years | ||
| 6-years |
Assorted Food Facts for Thought
This section features some charts and insights that I found interesting as I dug into the data.
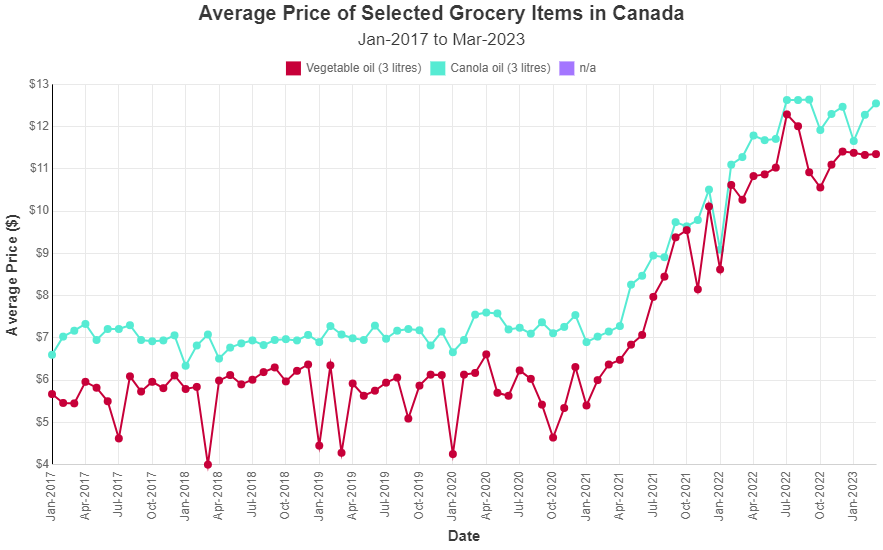
Oil On the Rise
Cooking oils have seen some of the steepest food price increases. While the cost of vegetable and canola oil was fairly steady from 2017 to 2019 (at roughly $6-$7 for 3 litres of oil), the years of 2020-2023 have prices double — with cooking oil now selling at approximately $12 per 3 litres.
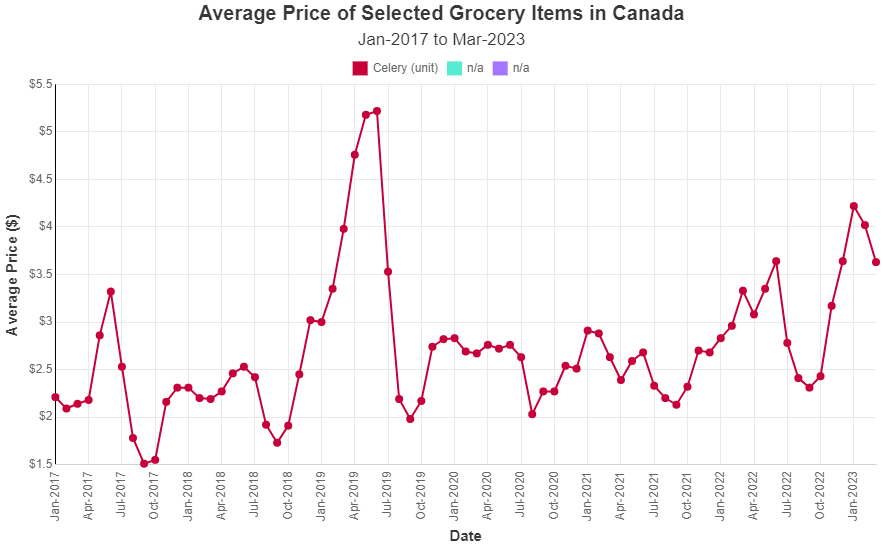
Celery Mania
With just a glance at the next chart, you could be forgiven for thinking that this shows a meme stock or cryptocurrency.
The answer is more mundane — instead, this shows the average price of celery in Canada. This negative-calorie nibble has seen wild price fluctations, bouncing between $1.50 to $5.00 per unit.
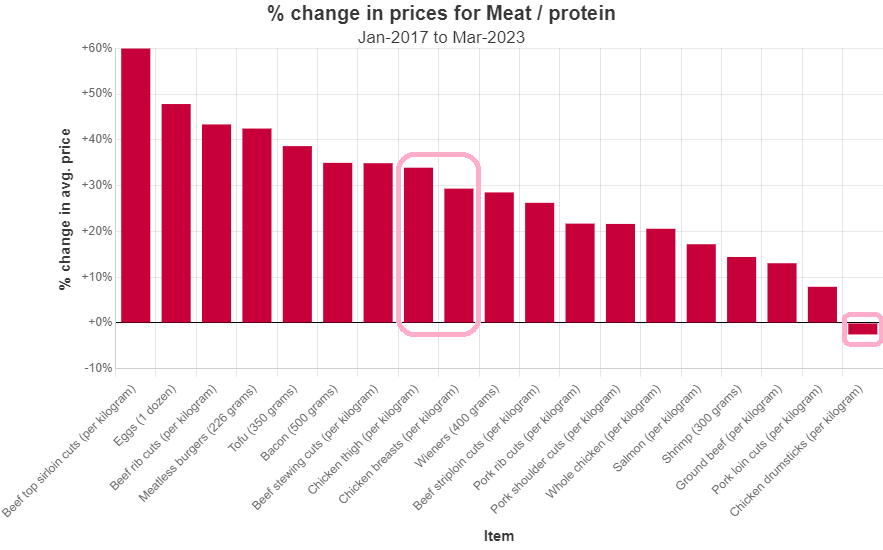
The Rise and Fall of Meat Prices
Next up, a chart which compares the percentage price increases of meat and protein items over the past 6 years.
While the price of chicken thighs and chicken breast has increased by roughly 30% (from 2017 to 2023), the price of chicken drumsticks has actually decreased by 2.5% over the same time period. A worthwhile consideration for your next summertime barbecue!
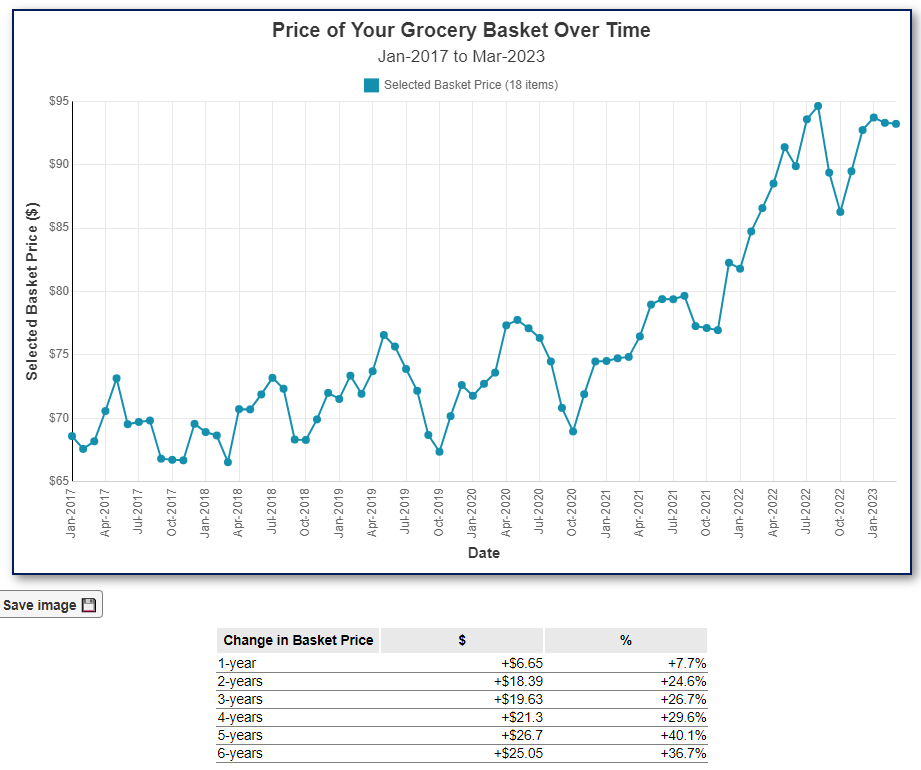
Tracking My Personal Food Inflation Rate
Here’s how the cost of my own typical grocery trip has changed over time:
- The cost of my basket of goods has increased by $25 over the past 6 years, from ~$68 in 2017 to ~$93 in 2023. This is an increase of ~37% over 6 years
- Over the last year alone (2022 vs 2023), my average grocery bill has increased by $6.65, or +7.7%
Feel free to compute your own personal food inflation rate and share your stats in the comment section at the bottom of this page.
Data Sources and Notes
The underlying data for this post comes from the following sources:
- StatCan data on monthly average retail prices for selected products
- StatCan methodological supplement for the provincial monthly average retail prices table
As noted in the second link: “the price data used in this analysis are calculated using scanner data (also known as transaction data) collected from Canadian retailers. Transaction data provide a comprehensive electronic record of the transactions made through a retailer’s point-of-sale system, and contain relevant pricing information, such as product descriptions and quantities sold. The use of transaction data for the calculation of the average prices in this table offers a significant quality advantage over traditional in-store collection, given the number of product prices available in the transaction data and the geographic coverage available.”
Related Reading
Other explorations into incomes, housing prices, taxes, and the overall cost of living in Canada:
- Exploring Canadian incomes by province, age group, and sex
- Tracking Canadian Housing Market Affordability — data on Canadian home prices and affordability by city, from 1999 to 2023
- Rent prices versus income in major Canadian cities
- 2023 Canadian income tax calculator — a resource to compare tax rates and after-tax incomes across Canada
—–
Header illustration credit:
[…] meals inflation calculator permits you to Monitor costs of quite a lot of grocery pieces during the last six years. Hen thighs are the particular […]
Your “Meat/Protein” section is oddly missing any reference to legumes other than soybeans (which is only referred in its transformed Tofu form).
I’m sensing a very common bias!
Legumes, lentils, and beans all appear in another category. Perhaps you should spend a bit more time looking at things in the future before jumping to conclusions as a result of your own bias?
[…] out of your bill and head over to the Measure of a Plan, a Canadian financial literacy website, for more ways to dissect your grocery […]
[…] Canadian Food Price Inflation — tracking prices for 110 foods […]
[…] The Measure of a Plan says: May 4, 2023 at 4:15 pm […]
[…] the subsets of a category have unequal inflation distributions. While the price of cooking oil has more than doubled sinced 2023, the price of limes has remained relatively stable. Eggs are 1.5 x more expensive than […]