July 26th, 2018 | Posted in Data & Insights
The True North Strong and… Pretty Expensive?
Canadians pronounce the letter z as “zed”, and are leading experts in snow shoveling techniques – this is known. But how much money does the average Canadian household spend in a year? This gets a bit trickier.
Using Stats Can data, we’ll dive into this question from the angles of province / income levels, and also see how the figures have changed over time.
Canadian Household Spend Over Time
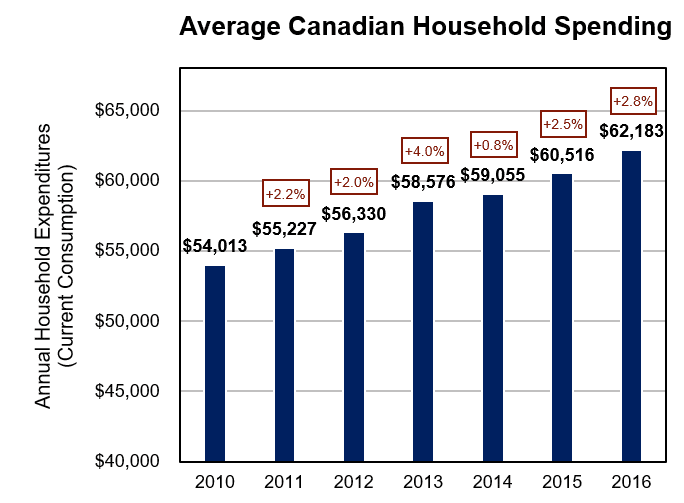
In 2016, the average Canadian household spent $62k. Compared to 2010, when the average household spent $54k, this is an increase of 2.4% per year.
For a country covering 10 million square kilometres and 6 time zones, a broad national average doesn’t do us much good, so let’s keep peeling back the onion.
Average Canadian Household Spend by Province
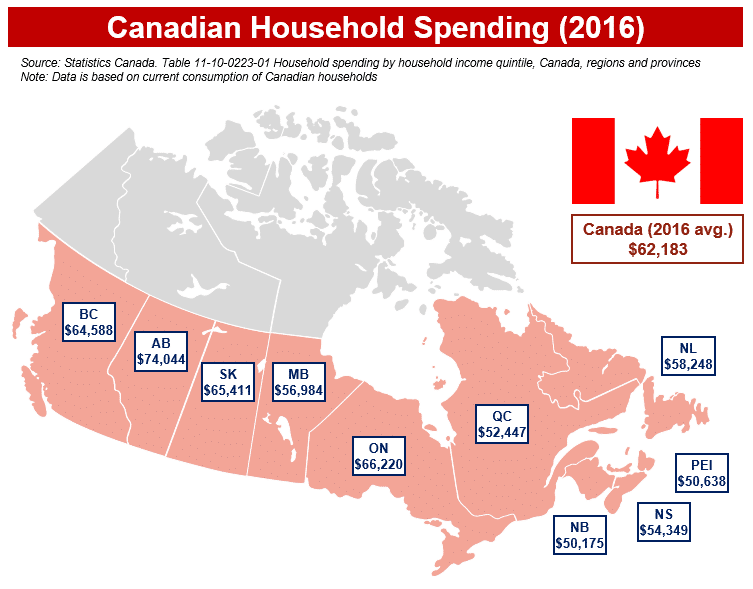
While the overall national average for spending is $62k, there are significant differences between the provinces.
Households in Alberta spent an average of $74k, while households in New Brunswick spent only $50k.
Quebec and the Atlantic provinces generally have lower household spending, while Ontario / the Prairies / the West have higher spending.
Note: Stats Can did not provide any data on the Territories, so they’ve been excluded from this analysis.
So, what exactly is all this money being spent on?
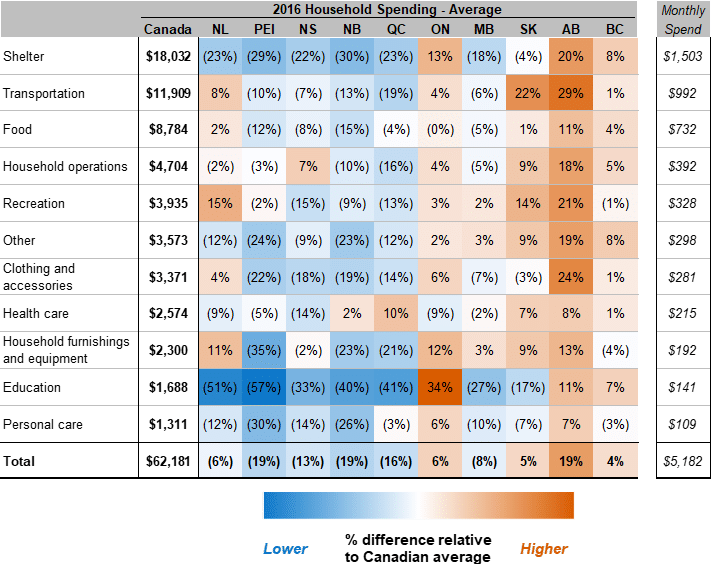
The chart above shows what the average Canadian household is spending their money on, and how each province compares against the national average.
The values in orange indicate spending which is higher than average, while the values in blue indicate spending which is lower than average.
Once again, we can see the pattern of Quebec & the Atlantic provinces spending less, while Ontario, the Prairies, and the West are spending more.
Unsurprisingly, spending on shelter is higher in Ontario (+13% vs the national average of $18k), Alberta (+20%), and BC (+8%) compared to the rest of the country. The sharp increase in home prices across Toronto, Calgary, and Vancouver is certainly behind that.
Spending on education is higher in Ontario (+34%) as well, driven by higher university tuition fees.
And I’ve got no good explanation for why Albertans outspend everyone else on clothing and accessories…
Note: ‘Household operations’ includes expenses such as phone/internet/cable, cleaning supplies, and child care. ‘Household furnishings and equipment’ includes spend on furniture and appliances. ‘Other’ includes spend on reading materials, tobacco, alcohol, gambling, and miscellaneous expenses.
Throwing Income Levels into the Mix
So far, we’ve been looking at Canadian household spend based on averages across everyone in the country / particular province.
Luckily, Stats Can also provides data on the spending of households in different income groups.
The chart below shows households split into “quintiles” based on pre-tax income. Effectively, all households have been sorted from lowest income to highest income, and then separated into 5 groups of equal size. The 20% of households with the lowest income are in the first quintile, while the 20% of households with the highest income are in the fifth quintile.
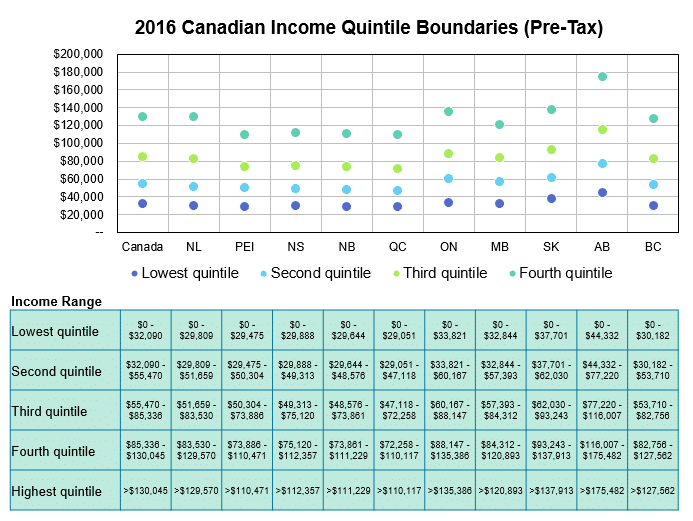
For Canada as a whole, the lowest quintile (0-20%) of households earn less than $32k per year. The highest quintile (80-100%) earns more than $130k per year.
As we’ve seen, Albertans spend the most. It also turns out that Albertans earn the most.
At each quintile level (from low to high income), Albertans have the highest incomes out of all provinces. The top 20% of households in Alberta earn more than $175k per year!
Canadian Household Spend by Income Level
So, how does a household’s income level impact the amount of money that they spend in a year?
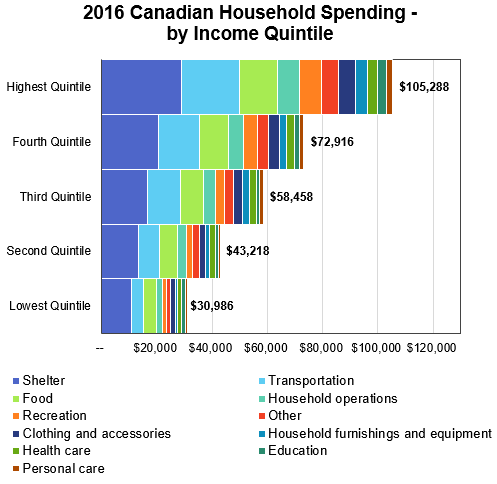
The more money that a household earns, the more money they spend. “Lifestyle inflation” is real and here to stay.
Canadians with the lowest incomes spend $31k per year, while the highest earners spend $105k per year.
In fact, the highest earners spend an average of $29k per year just on shelter, nearly equal to what the lowest income group spends on absolutely everything else.
Spending by Income Quintile and Province Over Time
Time to really let loose.
The chart below shows the spending of households by province and income quintile, from 2010 to 2016.
Across all income levels, Albertans continue to have the highest spending throughout the time period.
Meanwhile, Quebec and the Atlantic provinces are flip-flopping for the province with the lowest spending.
Looking just at the lowest income quintile, we see that the values haven’t moved that much over time. Annual spending for all provinces has stayed within the $20k to $40k range.
Meanwhile, big changes afoot for the highest earners. In 2010, the provinces ranged from spending $76k to $98k (a gap of $22k). By 2016, the range increased and widened to $79k to $121k (a gap of $42k – nearly doubling!).
The rich have been spending more and more, and the distribution of spending has gotten wider between provinces.
Final Thoughts
After going through this exercise, my takeaways are:
- Overall household spending is increasing at a relatively constant rate (~2% per year)
- Quebec and the Atlantic provinces tend to spend (and earn) less
- Alberta steals the show in terms of money earned and money spent; this pattern holds even when looking at the lowest income earners only
- As households make more money, they’re not shy about spending it
At this stage, you might be thinking – how does this all relate to me and my personal situation?
As they say, comparison is the thief of joy. Each and every family’s situation is different. Trying to benchmark your numbers against a broad average is often misleading and unhelpful.
As we’ve seen, the “average” Canadian household spend is heavily influenced by income level and the province that you live in. Not to mention other factors such as urban / rural locations and family size, which could be grounds for a future analysis…
It’s most helpful to compare yourself against your past self. If you don’t already do so, it’s a great idea to track your budget so that you can get a sense of where you stand today, and how you can make improvements to your personal situation.
Please let me know of any thoughts, comments, or questions in the comments below or via email at themeasureofplan@gmail.com.
To get the raw data and the charts shown here, you can download the excel file. I’d love to see different takes on visualizing this data set!
Cheers, and go Canada go!
—
Data source: Statistics Canada. Table 11-10-0223-01 Household spending by household income quintile, Canada, regions and provinces
Note: All household spending figures in this analysis are based on what Stats Can defines as “current consumption”. These figures exclude income taxes, pension contributions, and gifts of money.
This is awesome. I have been so curious on where I stand in the market based with multitude of perspectives and you have peeled the layers so well for me.
One question – this is for income taxes filed but I know so many people around me that don’t even pay the right taxes they under report. DOes this account for a variation of sorts to gauge this under reporting ?