October 13th, 2019 | Posted in Tools

Investing in the stock market through low-cost index funds (or ETFs) is widely accepted as a tried-and-true way to build wealth. It’s the path I’ve chosen with my own money, and I recommend it wholeheartedly to you as well.
That being said, with the reward comes the risk. Stock market returns are in a near constant state of zigging and zagging, and future market returns are extremely uncertain — even in the long-term.
To help you make plans in the midst of this uncertainty, you’ll find an interactive tool below that plots out how your net worth might evolve in the future based on historical sequences of returns from U.S. stock market history.
This tool uses a dataset of U.S. stock market returns covering the period of 1872 to 2018. Specifically, these returns are from the S&P composite index from 1872 to 1957, and the S&P 500 index onwards until 2018.
The length of this dataset allows us to see how our portfolios would be impacted if key events from stock market history repeat themselves — whether it’s the great depression, dotcom bubble, or the financial crisis of 2008.
In short: if we rely on the history of the U.S. stock market as a guide, how might our investments perform in the future?
Note: all dollar figures are shown on a “real dollar” basis (i.e., adjusted for inflation), and all market returns are shown on a “real total return” basis (i.e., adjusted for inflation and the re-investment of dividends).
An Illustrative Example
To give a sense for how this tool works, let’s take the case of Dwight and Ryan — colleagues and frenemies at your neighbourhood paper peddler.
- The year is 1999, Dwight has finished university a few years ago (a triple concentration in Beets, Bears, and Battlestar Galactica), and he’s ready to start investing
- Dwight has $5,000 to invest today, and plans to contribute an additional $3,000 to his portfolio each year
- Now introducing Ryan: he’s a little younger than Dwight, so Ryan starts to invest in 2009 (instead of 1999 for Dwight)
- Ryan has the same financial capacity as Dwight, with $5,000 to invest at the start, and a plan to add an additional $3,000 per year afterwards

Let’s see how Dwight and Ryan fared in the first 10 years of their investing careers.
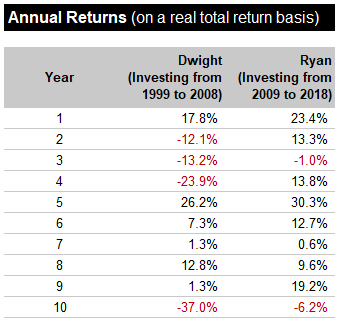
Dwight went through some pretty tough years, including the dotcom bubble bursting in 2000, and the great financial crisis of 2008.
In comparison, Ryan was lucky that his investing efforts began immediately after the market crash in 2008, meaning that he was able to put his money to work when stock prices were low, and a bull market was about to begin.
And now, let’s see how they fare on a dollar value basis. Note that Dwight and Ryan each contribute $35,000 to their savings over this 10-year time period.
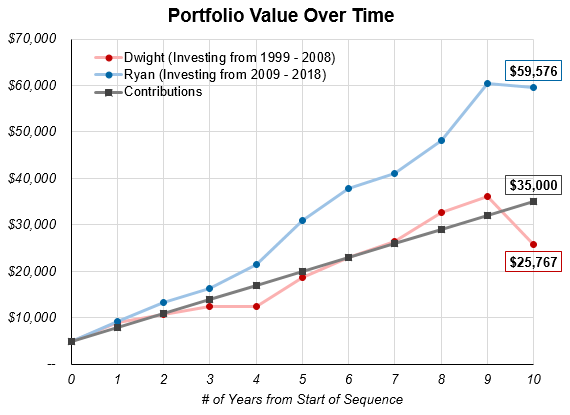
Both Dwight and Ryan had $5,000 at the start, but their paths diverged fairly quickly. By the end of 10 years, Dwight had $25,767 to show for his efforts, while Ryan had a whopping $59,576.
Over this time period, Dwight made an average return of -6% per year, while Ryan earned +9.6% per year.
It’s important to note that both of Dwight and Ryan followed the exact same recipe: they put $5,000 into the market at the start, added $3,000 to their portfolios each year, invested in a diversified index tracking the U.S. stock market (S&P 500), and held on for a 10-year period.
However, at the end of a decade, Ryan emerges with a net worth that is 2.3 times higher than Dwight!
On one hand, this seems deeply unfair. Ryan didn’t do anything differently than Dwight. He just lucked out that he started investing in 2009 instead of 1999 (even still, Ryan will smugly claim that he’s an MBA-educated stock market whiz).
On the other hand, it is what it is. Stock market returns are incredibly volatile, even if you have a long time horizon (10+ years).
Now let’s back up a bit. In the illustrative example of Dwight and Ryan, we saw how an investment in the stock market for 10 years fared during the periods of 1999-2008 and 2009-2018.
But what would the final answers be if we used stock market returns from the 1980s or 1970s instead?
Better yet, what would the answers be if we could analyze ALL of the 10-year sequences in stock market history… 1872 to 1881, 1873 to 1882, 1874 to 1883 … yada yada yada … and cycling through all the way up to 2009 to 2018.
The tool below is designed to do just that, allowing you to see how stock market volatility could impact your portfolio. Let’s jump in.
Visualizing Stock Market Volatility: An Interactive Tool

Please enter your assumptions below…
| Initial Contribution | $ | |
| Annual Contribution | $ | |
| Time Period | Years |
| Focus Year |
| Summary Stats | ||
|---|---|---|
| $ | Avg. Annual Return |
|
| Min | ||
| Median | ||
| Average | ||
| Max | ||
| Percentile Stats | ||
|---|---|---|
| $ | Avg. Annual Return |
|
| 10th | ||
| 25th | ||
| 50th | ||
| 75th | ||
| 90th | ||
Note: you can use the input cell above to display the portfolio $ value and % return metrics for any percentile rank (between 0 and 100).
Detailed Data Tables
The table below shows the answers — final portfolio value and average annual return — for each and every one of the sequences. This allows you to pinpoint specific time periods in market history.
You can sort the table by “time” (going from the oldest sequences up to the present day) or by “value” (going from the sequences with the lowest returns up to the sequences with the highest returns).
| Sequence | Final Portfolio Value | Avg. Annual Return |
|---|
So What’s The Point?
In building this tool, I had two main points that I wanted to illustrate.
Point #1: the stock market doesn’t grow at a constant rate of return.
Whether it’s from a personal finance book, blog, or robo-advisor site, I’d wager that you’ve heard a story along the lines of this…
If you invest regularly, earn an investment return of 7% per year, and wait patiently for a few decades, your net worth starts to go bonkers. Hundreds turn to thousands, tens of thousands, hundreds of thousands, and perhaps even millions.
This is typically accompanied by a chart that plots your net worth over time. You’ll see that the line grows up and to the right, in a smooth exponential growth curve. I’m guilty of this myself — see my take on this chart…
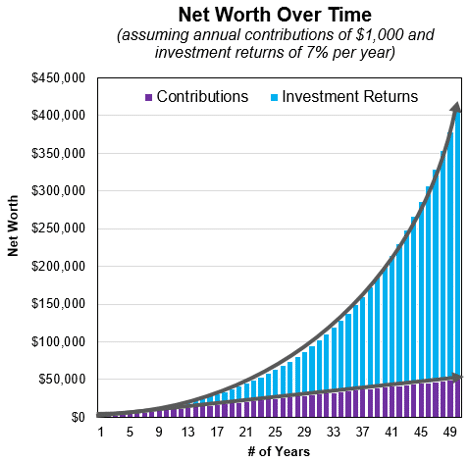
This story is simple, clearly illustrates the power of compound interest, and is a great way to get people excited about starting to invest.
However, the more nuanced and complex reality is that the stock market doesn’t grow at a fixed percentage rate, and that negative returns are a regular occurence.
The market can decline by 5%, 20%, or 37% (in the case of 2008) in a single year! There’s no guarantee that market prices will go up even when you look at 5 or 10-year periods.
If you’re expecting to get the smooth exponential growth curve, you’re setting yourself up for stress and disappointment.
You’re also setting yourself up to take actions that will hamper your long-term returns. For example, doing things like putting your regular contributions on pause when the market gets rocky, hoarding cash so that you can “buy in after the market crashes”, and selling your investments because the pundits of the day are calling for a recession.
By acquainting yourself with the range of possible outcomes that can occur when you invest in the stock market, you’ll be more likely to stay the course in times of volatility.
It also bears mentioning that you can reduce the volatility of your investments by allocating a portion of your portfolio towards bond investments. By investing in bonds, you reduce the risk of suffering large losses in your portfolio, with the trade-off being that you also somewhat reduce the maximum upside potential of your portfolio.
Point #2: in the face of uncertainty, it’s wise to plan for a range of possible outcomes in the future.
No one knows how the stock market will perform in the next 10 days, months, or years.
In a very fuzzy and general sense, we know that the stock market tends to go up over long periods of time (>10 years).
However, this tool shows that the range of possible outcomes is extremely wide, even if you stretch out your time horizon to 20 years or more.
As a result, it’s prudent to design your financial plans based on a range of possibilities, instead of using one fixed assumption (e.g., market returns of 7% per year).
For example, how does your plan change if the market ‘only’ grows at 6% per year. How do the answers change if you assume 5%, 4%, or 3%?
One practical way to implement this would be to design your plans around a “base case” scenario, a “downside case”, and a “worst case”.
If you think about the future as a set of potential outcomes instead of a single fixed frame, you’ll be more prepared to deal with adversity when it comes about.
Notes and Final Thoughts
Your regular annual contributions are assumed to be made at the end of the year.
The figures for ‘return per year’ represent the annualized IRR of your portfolio.
This tool uses historical data from the U.S. stock market, with a period ranging from 1872 to 2018. In this case, the “U.S. stock market” refers to the S&P composite index from 1872 to 1957, and the S&P 500 index from 1957 and onwards.
The S&P composite returns have been meticulously collected and made available by Professor Robert Shiller. The S&P 500 data was pulled from Yahoo Finance.
All of the returns are presented on a “real total return” basis, meaning that they are adjusted for inflation (i.e., real returns), and also adjusted for the re-investment of dividends received (i.e., total returns).
If you’re hungry for more charts and analysis, I’ve written a seperate article covering the history of the U.S. stock market.
—
Header image credit: Maria Hergueta
Loading animation credit: Jarod Erondu and Jeremy Goldberg
Another good piece of information (a grateful user of the Portfolio tracker here). Thank you!
I was wondering if you could share the S&P 500 annual return table as well and the source? When I was looking for it I saw quite a bit of difference between sources on the net (some taking into consideration inflation, others not, than some other that I don’t know if even they knew what were sharing :)).
Oh never mind my last comment. I should read the notes section before asking for data…
Hey Free Space,
Glad to hear that you found the notes at the bottom of the post. I usually try to include any explanatory notes and data sources at the bottom of my posts, so that curious readers can explore further.
Cheers!
I would have never guessed 1911-1920 was the worst 10yr period. Thanks.
Hey DW,
Good observation, I was curious about that as well. Based on some quick digging, it seems that there were quite a few recessions during that time period.
https://en.wikipedia.org/wiki/List_of_recessions_in_the_United_States
– Panic of 1910-1911
– Recession of 1913-1914
– Post WWI recession
– Depression of 1920-1921
A pretty scary decade!
I strongly feel that all articles written on ETF’s are mostly written from US market point of view and talked widely in India and published here as an emerging market. However, i beg to differ as all the ETF’s do not work in India as we have just 30 stocks and 50 stocks in our key indices while US has 3000 stocks average where the index fund is better any day due to the sheer size of stocks & duplication of sectors.
Hi Shashank,
Good points about U.S. / North American bias. It’s certainly the case that most investing articles focus on a North American perspective — mainly due to the large investor base in the U.S. / Canada, and given that we have access to a long history of data from these markets. For example, in this post I’ve used U.S. stock market returns from 1872 to 2018 (147 years!).
For your specific points about investing in Indian ETFs, I will confess that I have very little knowledge in that area. However, I would recommend that you try to invest your money across a globally diversified portfolio, instead of just investing in Indian companies.
Some further reading:
https://economictimes.indiatimes.com/wealth/invest/indian-investors-should-add-foreign-stocks-to-their-investment-portfolios/articleshow/64894792.cms?from=mdr
https://www.theglobaleconomy.com/rankings/stock_market_capitalization_dollars/
As you can see from the second link, Indian stocks only make up a small fraction of the global stock market.
Very interesting and informative
hello The Measure of a Plan,
would you please update the data to 2023 ?
thanks
Hi, how can we update the data and make it nominal returns so we can proyect future returns. I turns to be that the returns are independent of inflation or thats what i want to see. It will be cool if we can run the code with other datasets that i have, for example mixing interantional stocks and bonds.
Can you fix the slider bar