April 2nd, 2021 | Posted in Data & Insights, Tools

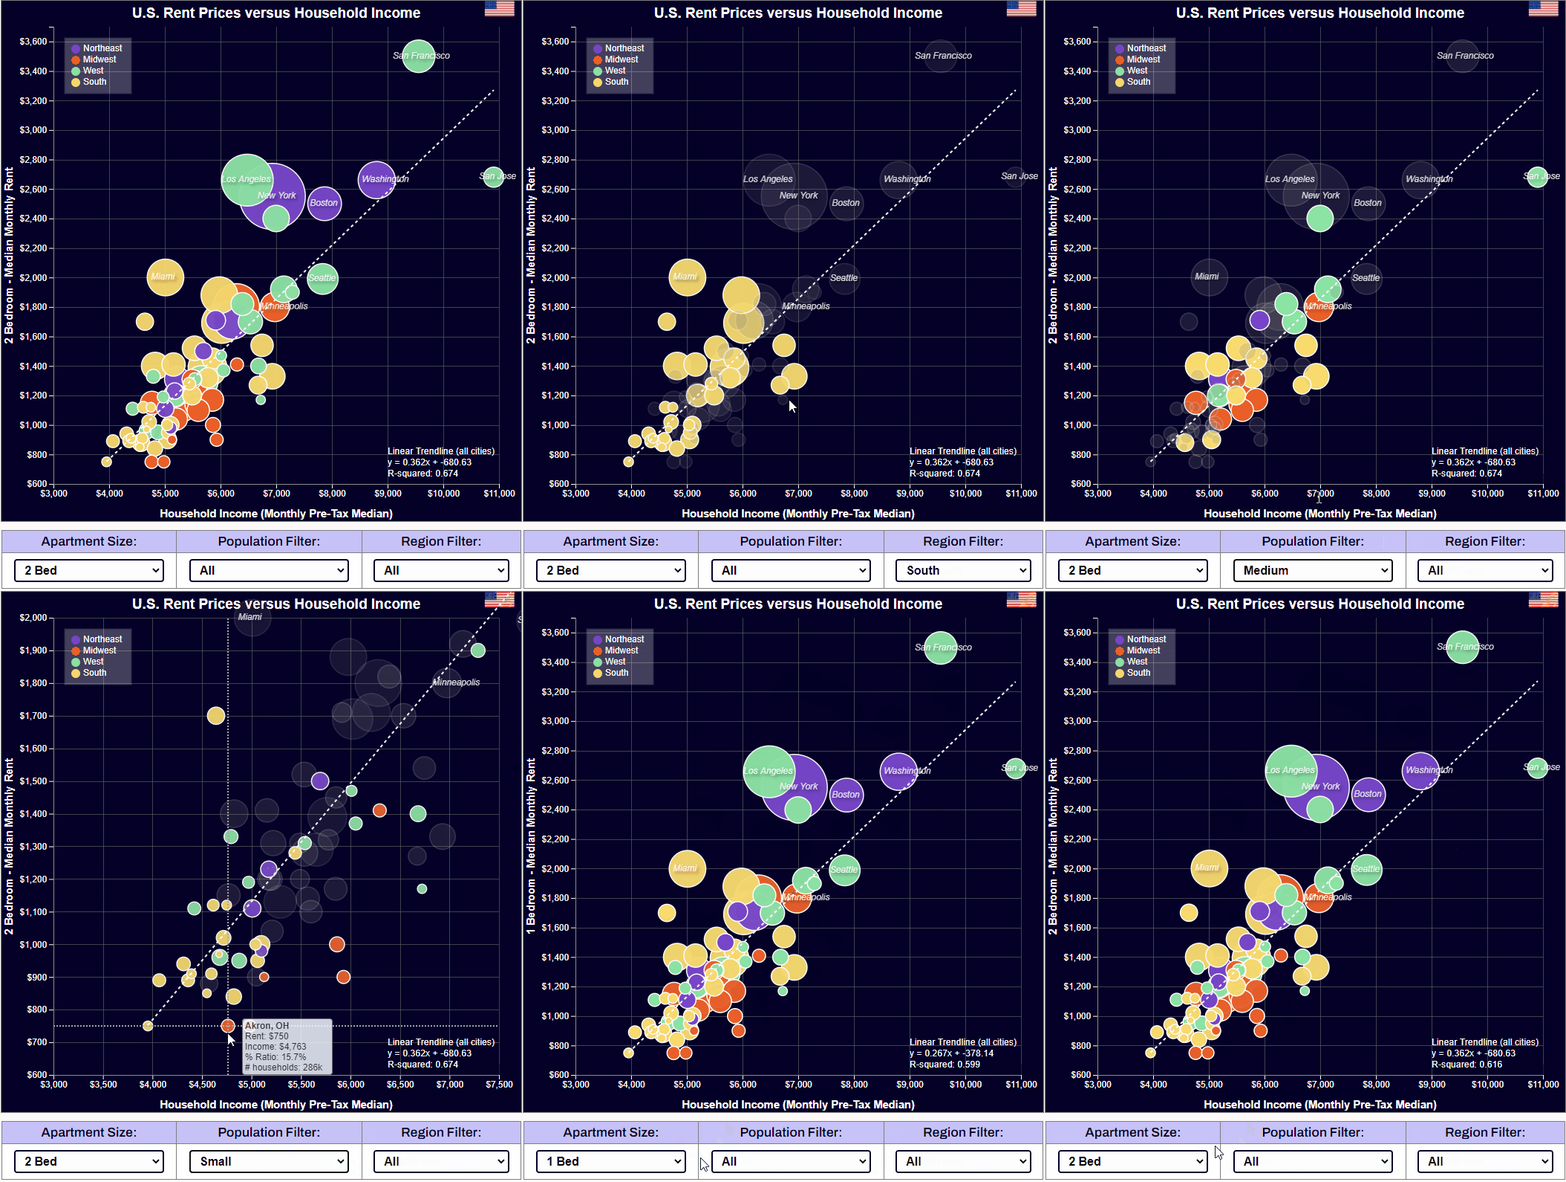
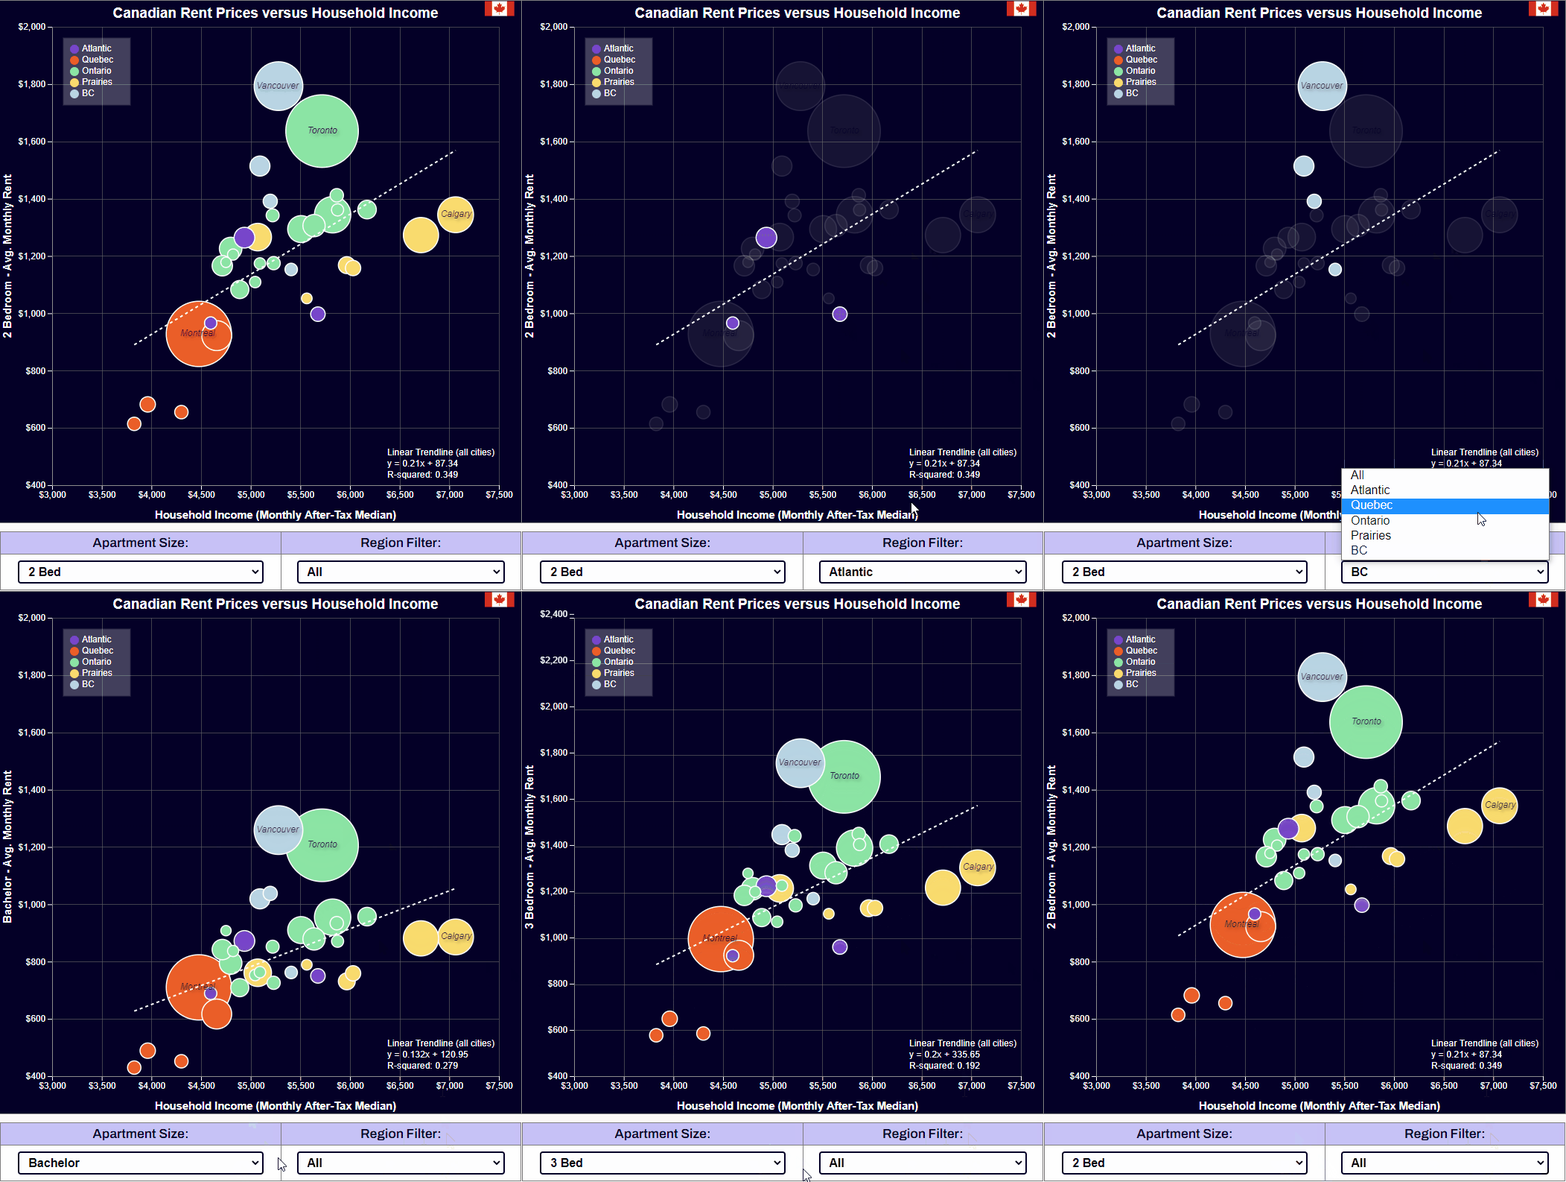
These interactive charts let you explore rent prices versus household income in major cities in the U.S. and Canada.
Dig into questions like:
- How do rent prices in New York compare against LA?
- Are average incomes higher in Toronto or Vancouver?
- Which city on the West Coast offers the best mix of high incomes and low rent prices?
- What are the average 1 bedroom / 2 bedroom rent prices in my city?
See the bottom of the page for a spreadsheet export and the underlying source data.
Enjoy!
U.S. Rent Prices Versus Income
Each “bubble” in the chart represents a city. The bubbles are sized based on the population in that city. Hover over any of the bubbles for more info.
| Apartment Size: | Population Filter: | Region Filter: |
|---|---|---|
Canadian Rent Prices Versus Income
| Apartment Size: | Region Filter: |
|---|---|
The Canadian incomes are based on StatsCan’s latest data for household incomes by census area (2015), adjusted upwards by 9.57% to reflect the nationwide inflation rate between 2015 and 2020. The same % increase has been applied in all cities.
Average rent prices by city are as of 2020, based on a StatsCan / CMHC dataset.
Note that the Canadian income data is shown on an after-tax basis, while the U.S. incomes are shown on a pre-tax basis. Hence, they are not directly comparable.
U.S. Data Table 🇺🇸
| City | State | Region | # of Households | Monthly HH Income (Pre-Tax) | 1 Bedroom Rent | 2 Bedroom Rent |
|---|
Canadian Data Table 🇨🇦
| City | Province | # of Households | Monthly HH Income (After-Tax) | Bachelor Rent | 1 Bedroom Rent | 2 Bedroom Rent | 3 Bedroom Rent |
|---|
Animated GIFs
The GIFs below can be downloaded & shared elsewhere.
Related Reading
- A history of homes prices in North America
- Rent versus buy calculator — a spreadsheet for crunching the rent vs buy math
- Exploring Canadian income — by geography, sex, and age
Data Sources
U.S. data sources:
- Income: U.S. Census Bureau, 2019 Median Income by Metropolitan Statistical Area
- Rent prices: Zumper National Rent Report: March 2021
Canadian data sources:
- Income: StatsCan income highlight tables, 2016 census
- Rent prices: Canada Mortgage and Housing Corporation, 2020 average rents by city
- Inflation: Bank of Canada inflation calculator, used to adjust the Canadian incomes to 2020
—
Header image credit: Romain Trystram


Amazing! I look forward to your posts. Thank you so much for all that you do!!!
Thanks Vin — I really appreciate that 🙂
Love this post! Though it pains me to see just how unaffordable Miami can be.
Thanks Michi! Unfortunately the “sunshine tax” seems to be in effect in Miami.
Amazing job, these are beautiful visuals!
It’s sad days for my fellow Vancouverites. Especially those with single income households.
Thanks Sammy. Indeed, having two incomes in the home / getting help from the “bank of mom & dad” seems to be becoming a requirement in Canada’s largest cities.
[…] Rent prices versus income in major U.S. and Canadian cities. [The Measure of a Plan] — This is an interactive widget (no real text to speak of) that plots average rent in major cities against average household income. It’s all averages and it’s all stats, but it’s still fascinating. Kim and I are about to rent for the first time in decades, and we don’t know where we want to live, so this is a useful tool for us. […]
Hi, for the Ottawa-Gatineau region of the Canada map, it looks like you’ve selected the data for a 2-bed in Quebec (Gatineau) only, meaning you’ve excluded Ottawa. The 2020 rent for Ottawa-Gatineau (both the Ontario and Quebec side) is in the $1300-$1400 range, not $970. $970 is for Gatineau only. Thanks for putting this together though, neat tool. 🙂
Hi C,
Great catch, thank you! Indeed, I picked up the wrong row from the StatsCan data (Ottawa-Gatineau, Quebec Part, rather than Ottawa-Gatineau).
The interactive chart is now fixed!
Thanks again 🙂
This is a great chart. Do you have updated numbers for the end of 2022?
[…] Rent prices versus income in major Canadian cities […]